Chapter 13. Metrics and Analytics


13. SOP and procedure fragments
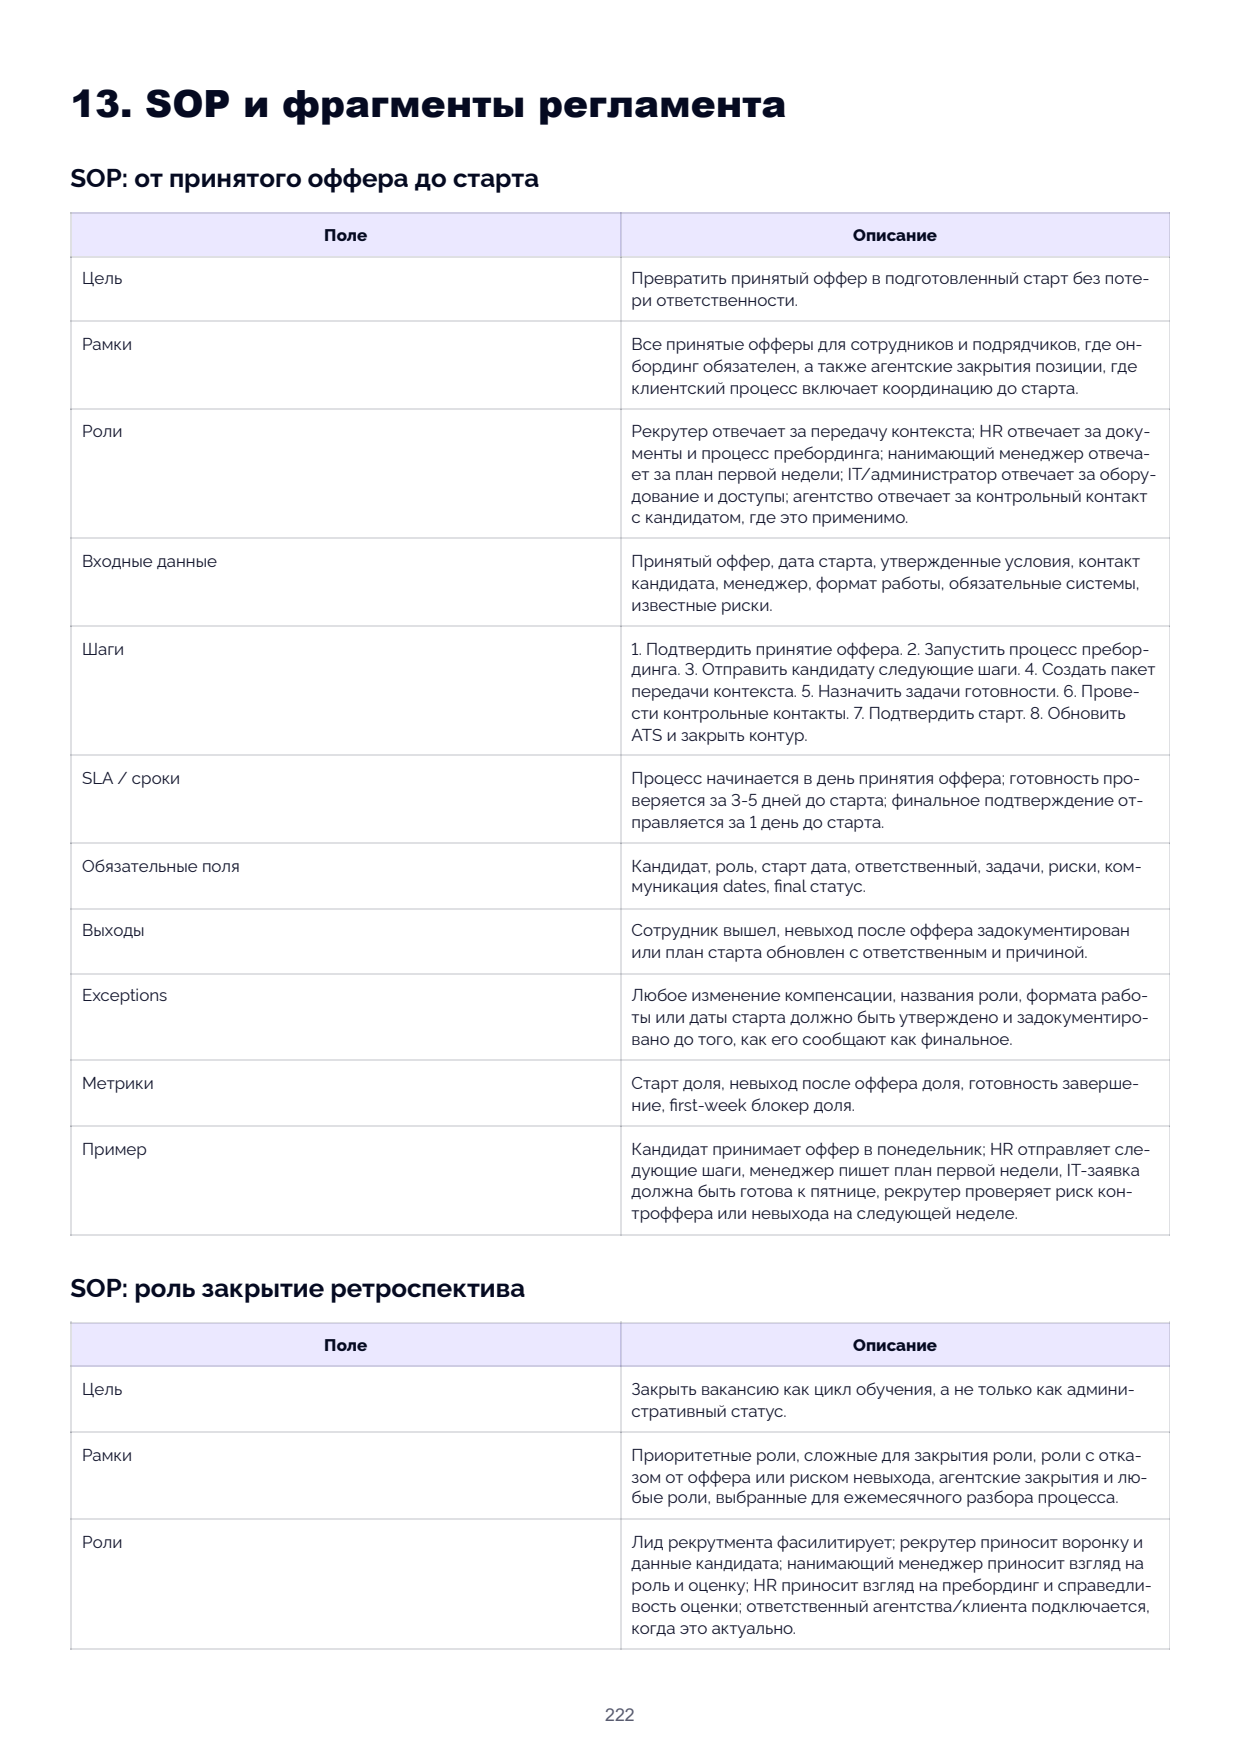
SOP: from accepted offer to start date
Field Description
Purpose Turn an accepted offer into a prepared start without loss of
responsibility.
Scope All accepted offers for employees and contractors where on-
boarding is mandatory, as well as agency-filled positions where
the client process includes coordination before start.
Roles The recruiter provides context handover; HR manages documents
and preboarding; the hiring manager owns the first-week plan;
IT/administrator handles equipment and access; the agency
manages the check-in contact with the candidate, where applicable.
Inputs Accepted offer, start date, approved terms, candidate contact,
manager, work format, required systems, known risks.
Steps 1. Confirm offer acceptance. 2. Start preboarding. 3. Send the
candidate next steps. 4. Create a context handover pack. 5. Assign
readiness tasks. 6. Conduct check-ins. 7. Confirm start. 8. Update
ATS and close the loop.
SLA / deadlines Process begins on offer acceptance day; readiness is checked
3–5 days before start; final confirmation is sent 1 day before
start.
Mandatory fields Candidate, role, start date, responsible person, tasks, risks,
communication dates, final status.
Outputs Employee started; non-start after offer is documented or start
plan is updated with responsible person and reason.
Exceptions Any change to compensation, role title, work format, or start
date must be approved and documented before it is communicated
as final.
Metrics Start rate, non-start after offer rate, readiness completion,
first-week blocker rate.
Example A candidate accepts the offer on Monday; HR sends next steps,
the manager writes the first-week plan, the IT request should be
ready by Friday, the recruiter checks for counter-offer or non-start
risk the following week.
SOP: role closure retrospective
Field Description
Purpose Close a vacancy as a learning cycle, not merely an administrative
status.
Scope Priority roles, roles difficult to fill, roles with offer refusal or
non-start risk, agency fills, and any roles selected for monthly
process review.
Roles The recruitment lead facilitates; the recruiter brings the funnel
and candidate data; the hiring manager brings the role view and
assessment; HR brings the preboarding and assessment fairness
view; the agency/client responsible person joins where relevant.
| Field | Description |
|---|---|
| Inputs | Funnel, SLA, source, rejection reasons, assessment cards, offer data, preboarding blockers, candidate feedback where available. |
| Steps | 1. Review role goal. 2. Review funnel and SLA. 3. Review assessment and offer. 4. Review preboarding and start readiness. 5. Identify lessons. 6. Update templates, criteria or process. 7. Assign owners. |
| SLA / deadlines | Within 1 week of start for priority roles; within 48 hours for urgent process failures. |
| Mandatory fields | Lessons, decisions, template changes, owners, deadlines, metrics to track. |
| Outputs | Retrospective note, updated SOP items, action log. |
| Exceptions | Do not include sensitive candidate details beyond what is needed for process learning. |
| Metrics | Retrospective completion, action completion, repeat problem rate. |
| Example | A role has repeated rejections due to compensation; the retrospective schedules a pay band review before the next launch. |
| 14. Implementation plan and maturity model — 1 day | |
| Action | Result |
| Assign a responsible person from accepted offer to start | Responsibility is not lost after offer |
| Create a start readiness checklist | Day one becomes manageable |
| Introduce candidate check-in after offer acceptance | Silence risk is reduced |
| Add non-start after offer and start status | Losses between offer and start become visible |
| Define a strong finalist rule | Finalists are closed respectfully |
| 1 week | |
| Action | Result |
| Set up context handover pack template | Manager, HR, IT and buddy receive the right context |
| Run cleanup for closed vacancies | ATS and communications become clean |
| Add role retrospective agenda | Closed roles deliver lessons |
| Check first-week blockers for recent hires | Preboarding issues become visible |
| Agree agency post-offer-acceptance protocol | Position closure risk is managed before start |
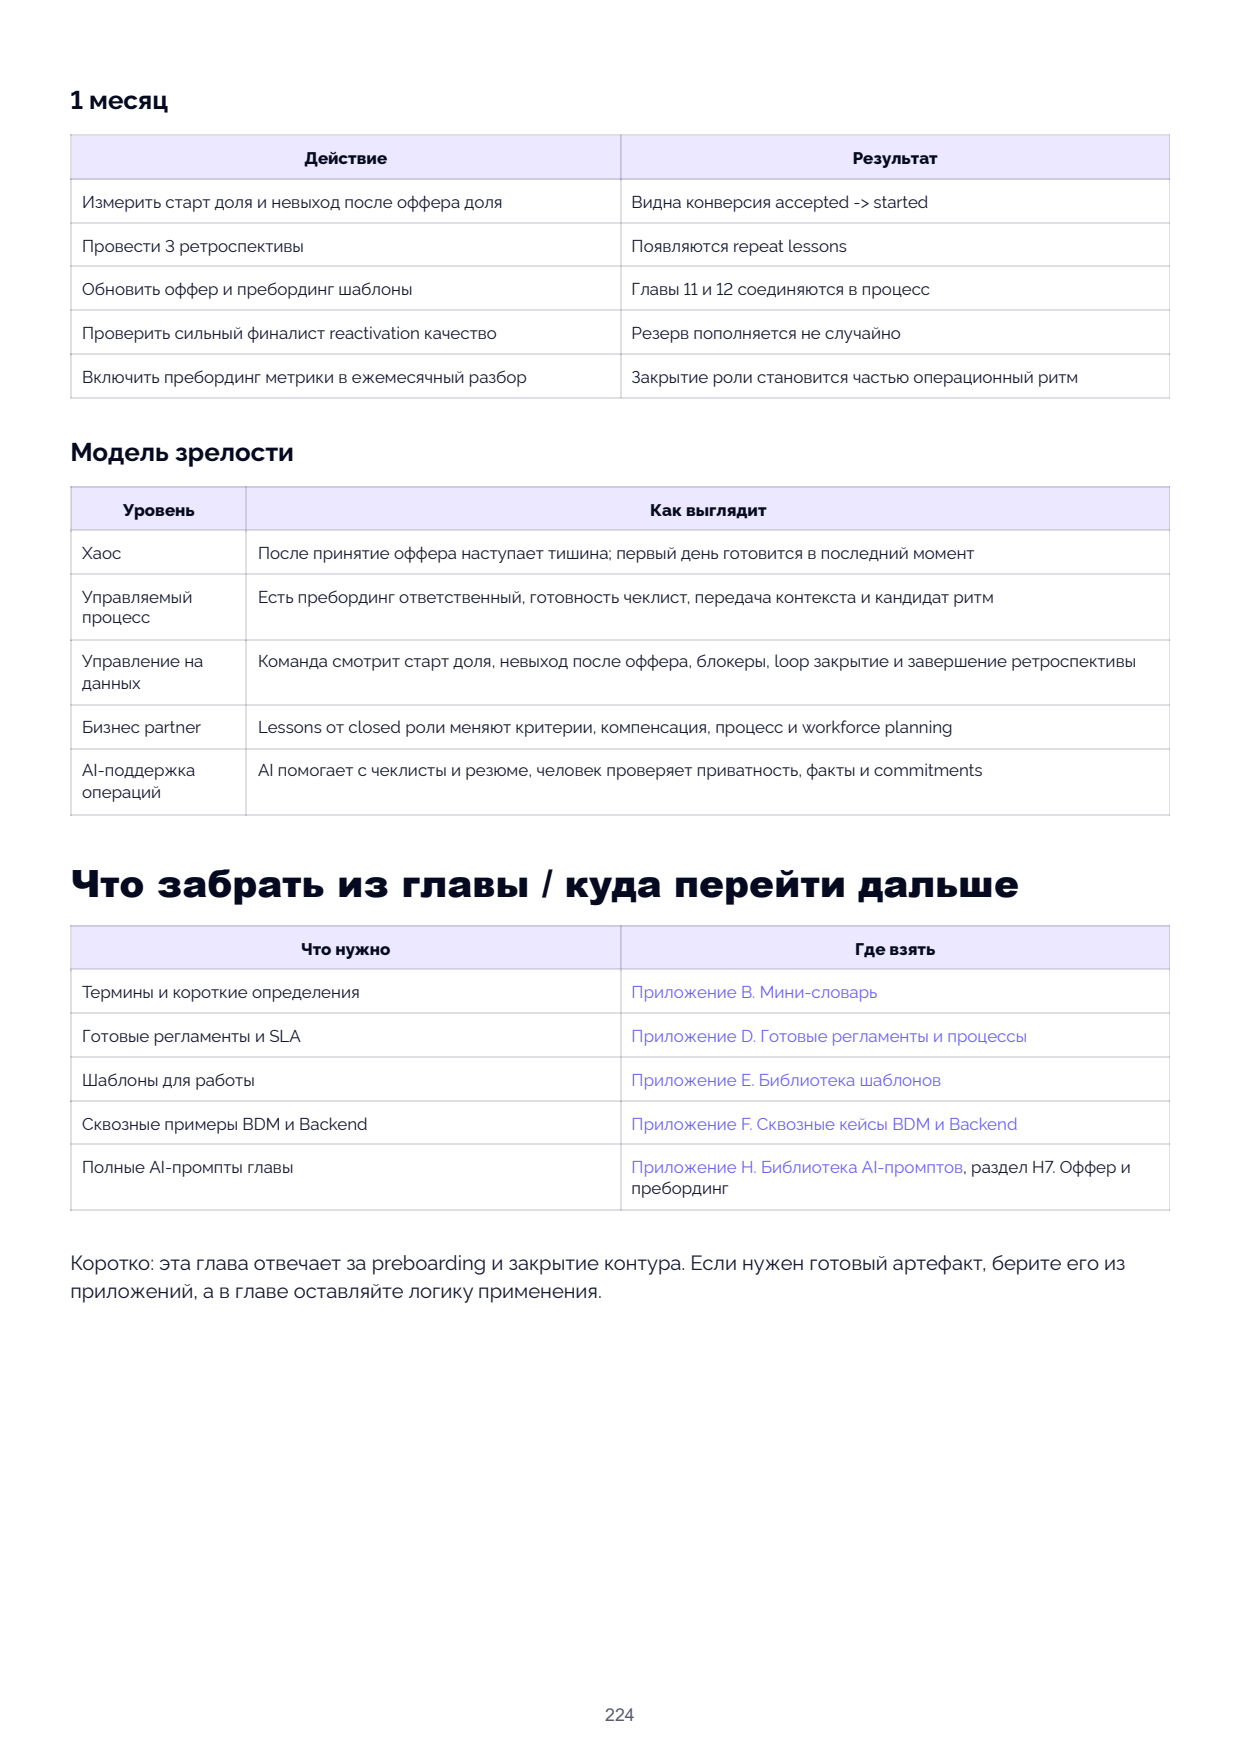
| 1 month | |
|---|---|
| Action | Result |
| Measure start rate and non-start after offer rate | Accepted-to-started conversion is visible |
| Run 3 retrospectives | Repeat lessons emerge |
| Update offer and preboarding templates | Chapters 11 and 12 join into one process |
| Check strong finalist reactivation quality | Pipeline is replenished intentionally |
| Include preboarding metrics in monthly review | Role closure becomes part of the operational rhythm |
| Maturity model | |
| Level | What it looks like |
| Chaos | After offer acceptance, silence follows; day one is prepared at the last moment |
| Managed process | There is a preboarding owner, a readiness checklist, context handover and a candidate cadence |
| Data-driven | The team reviews start rate, non-start after offer, blockers, closure loop and retrospective completion |
| Business partner | Lessons from closed roles change criteria, compensation, process and workforce planning |
| AI-assisted operations | AI helps with checklists and summaries; a person verifies privacy, facts and commitments |
| What to take from this chapter / where to go next | |
| What you need | Where to find it |
| Terms and short definitions | Appendix B. Mini glossary |
| Ready-made procedures and SLA | Appendix D. Ready-made procedures and processes |
| Templates for use | Appendix E. Template library |
| End-to-end BDM and Backend examples | Appendix F. End-to-end BDM and Backend cases |
| Full AI prompts for this chapter | Appendix H. AI prompt library, section H7. Offer and preboarding |
How to use this chapter
Working scenario. The HRD opens a report and sees: there are many vacancies, there seem to be enough candidates,
but hiring is not accelerating. Recruiters talk about a tough market, managers about a weak shortlist, the agency
about slow feedback. The numbers are all there, but there is no conversation about solutions: where exactly is the
bottleneck, who owns it, what are we changing this week and how will we know things have improved.
What actually broke here: the report exists but there is no management action. Metrics are not needed to punish
recruiters or to build a pretty dashboard. They are needed to find bottlenecks: where candidates are lost, where a
decision stalls, which source delivers quality, why offers are declined, which vacancies overload the team, where SLA
is breached and where there is a personal-data risk.
Read this chapter as a practical working module on recruitment analytics. If you are a recruitment lead, start with
the metrics map and the weekly review. If you are the HRD, use the sections on dashboards, interpretation and
management decisions. If you are an agency, focus on client reporting, feedback discipline and shortlist quality
protection. If you are an in-house recruitment team, use HarmonyATS reports as an example of a working loop:
vacancy, candidate, stage, rejection reason, SLA, recruiter, data-processing consent, source and funnel.
The chapter's golden rule: a metric is never a verdict. A single figure rarely explains the cause. Strong analytics
combine quantitative reporting, qualitative review and action with the owner. If the SLA report shows overdue
items, it does not mean "the recruiter is bad". It means: you need to understand the stage, owner, cause, business
priority, workload, decision-making authority and next step.
Remember in one phrase
A metric is only useful when it is followed by a decision with the owner.
| If your task is | Go to section | What you will get |
|---|---|---|
| Quickly build a dashboard | 1–2 | Minimum metrics set and interpretation rules |
| Understand HarmonyATS reports | 3 | Report map and management questions |
| Find a bottleneck in the funnel | 4–6 | Funnel diagnosis, candidate movement, SLA and time-to-hire |
| Evaluate sources | 7 | Source quality without the volume trap |
| Understand rejections | 8 | Rejection reasons as a process quality signal |
| Manage recruiter workload | 9 | Recruiter report without turning it into an activity punishment |
| Monitor vacancies and consent | 10 | Vacancy report and data-consent report |
| Prepare for a meeting or audit | 11–12 | Weekly and monthly review templates |
| Use AI | 14 | Prompts with human review |
| Grab the reference | 16 | Terms, formulas, templates, prompts, related chapters |
Minimum starting point
A good dashboard starts not with the number of charts, but with the questions the team is ready to act on.
Step What to do Artifact
1 Choose 6–8 metrics for weekly review: Minimum dashboard
funnel, SLA, sources, rejection reasons, offer,
workload
2 For each metric, record the question, formula, risk of Metric card
wrong interpretation and action
| Step | What to do | Artifact |
|---|---|---|
| 3 | Discuss not "who is to blame" but which stage, owner or criterion needs action | Action rule |
| 4 | After the meeting, record the owner, deadline and verification metric | Analytics action log |
1. What recruitment analytics is: a process, not reporting
Recruitment analytics is the discipline of regularly reading hiring data to improve the process. It answers not
"how much did we do" but "what is happening with the system and what needs to change". A good report should
lead to one of five decisions: change the process, change the criteria, rebalance workload, escalate the owner
or test a hypothesis. Bad analytics looks busy but helps no one. The team shows the number of CVs, interviews,
emails and calls, but cannot see why candidates never reach offer. Or it compares recruiters by the number of
added candidates without accounting for role complexity. Or it looks at time-to-hire but does not separate
feedback delay from genuine market absence.
| Analytics type | What it shows | Weak use | Strong use |
| Descriptive | What happened | "This month there were 120 candidates" | "120 candidates, but 70% lost at screening due to criteria mismatch" |
| Diagnostic | Why it happened | "The funnel is poor" | "The funnel drops after the manager interview; reasons point to role mismatch" |
| Operational | What to do now | "There are overdue items" | "7 candidates are waiting for feedback beyond SLA; owner is the hiring manager; deadline is today" |
| Strategic | What to change in the system | "We need people" | "Recruiter capacity is not the bottleneck; the bottleneck is client SLA on feedback and the pay band" |
2. How to design a dashboard without the punishment trap
A minimum dashboard is best built around questions, not around every available chart. For a weekly review,
6–8 indicators suffice. For a monthly audit you can add trends, source comparison, rejection quality and
consent hygiene.
Question Metric Formula / reading What not to do
Where are candidates now? Candidates by stage Number of active candidates Do not equate a full funnel
at each stage with quality
| Question | Metric | Formula / reading | What not to do |
|---|---|---|---|
| Where are we losing candidates? | Stage conversion | Candidates who passed the stage / candidates who entered the stage | Do not compare different roles without context |
| Where is it slow? | Time at stage / SLA breach | Days at stage and overdue candidates / active candidates | Do not blame the responsible person without understanding the delay cause |
| What fills the role? | Time-to-hire | Days from candidate entry to accepted offer / hire by company rule | Do not compare mass junior hiring with senior search |
| Which sources deliver quality? | Source-to-stage / offer conversion | Candidates from source who reached the stage / all candidates from source | Do not choose a source on volume alone |
| Why do we reject or why are we rejected? | Rejection reason mix | Share of reasons by stage, role, source | Do not use vague reasons as analytics |
| Where is the workload? | Recruiter workload | Active vacancies, candidates in process, shortlisted candidates, actions | Do not count number of actions as quality |
| Where is the data risk? | Consent coverage | Candidates with valid consent / candidates requiring consent | Do not ignore retention and deletion |
3. HarmonyATS report map: which question
each report supports
Using HarmonyATS as an example, it is useful to organise reports by management question. A single report rarely
gives a ready answer; more often it provides input for review.
HarmonyATS report What question it answers What to look at Risk of misuse What to cross-reference
Resume-source report Which sources deliver not just Source-to-stage conversion, Close a channel with low Funnel with details, notes,
volume but quality? offers by source, rejection volume even though it delivers cost / effort per
reasons by source strong finalists source
Rejection report Why do candidates or the team Stop reasons by stage, role, Assume reasons are true If taxonomy is dirty notes, debrief,
halt the process? source, recruiter and manager candidate feedback
Candidate-movement What actually moved in the Stage changes, finalist Accept movement as Funnel, SLA, qualitative
report process? movement, recruiter actions progress review
Funnel-with-details Where is the bottleneck, Stage entries, pass-throughs, Compare different roles as Role complexity, hiring
report conversion and loss? rejections, sources and the same plan, market context reason patterns
Time-to-hire report How long does the path to Total days, days by stage, Make speed the sole Quality, offer acceptance,
hire take? loss along the way objective role complexity
SLA report Where have candidates stalled Overdue candidates, days Use as a public blame Owner, cause, blocker,
beyond the limit? overdue, vacancy and stage board escalation
| HarmonyATS report | What question it answers | What to look at | Risk of misuse | What to cross-reference |
|---|---|---|---|---|
| Recruiter report | What is the workload and working activity of recruiters? | Added candidates, offers, rejections, actions, emails, meetings, comments, stage changes | Evaluate a person on activity alone | Vacancy complexity, result quality, workload |
| Vacancy report | Which vacancies are active and where are candidates distributed? | Active vacancies, candidates by stage, empty stages | Look at a snapshot without business priority | Hiring plan, cost of unfilled vacancy, SLA |
| Data-consent report | Which data can we store and use? | Consent status, retention period, records without valid consent, bulk requests | Treat the report as a legal decision | Legal policy, candidate communication, retention procedure |
4. Funnel with details: how to find bottlenecks,
not culprits
The "Funnel with details" report shows how candidates progress through stages and where they are lost. But a
funnel on its own does not say whether this is good or bad. High attrition at screening could signal strong
filtering or weak sourcing. Low attrition at interview could mean a quality shortlist or an overly lenient
assessment. The funnel is therefore read through role context, criteria and reasons.
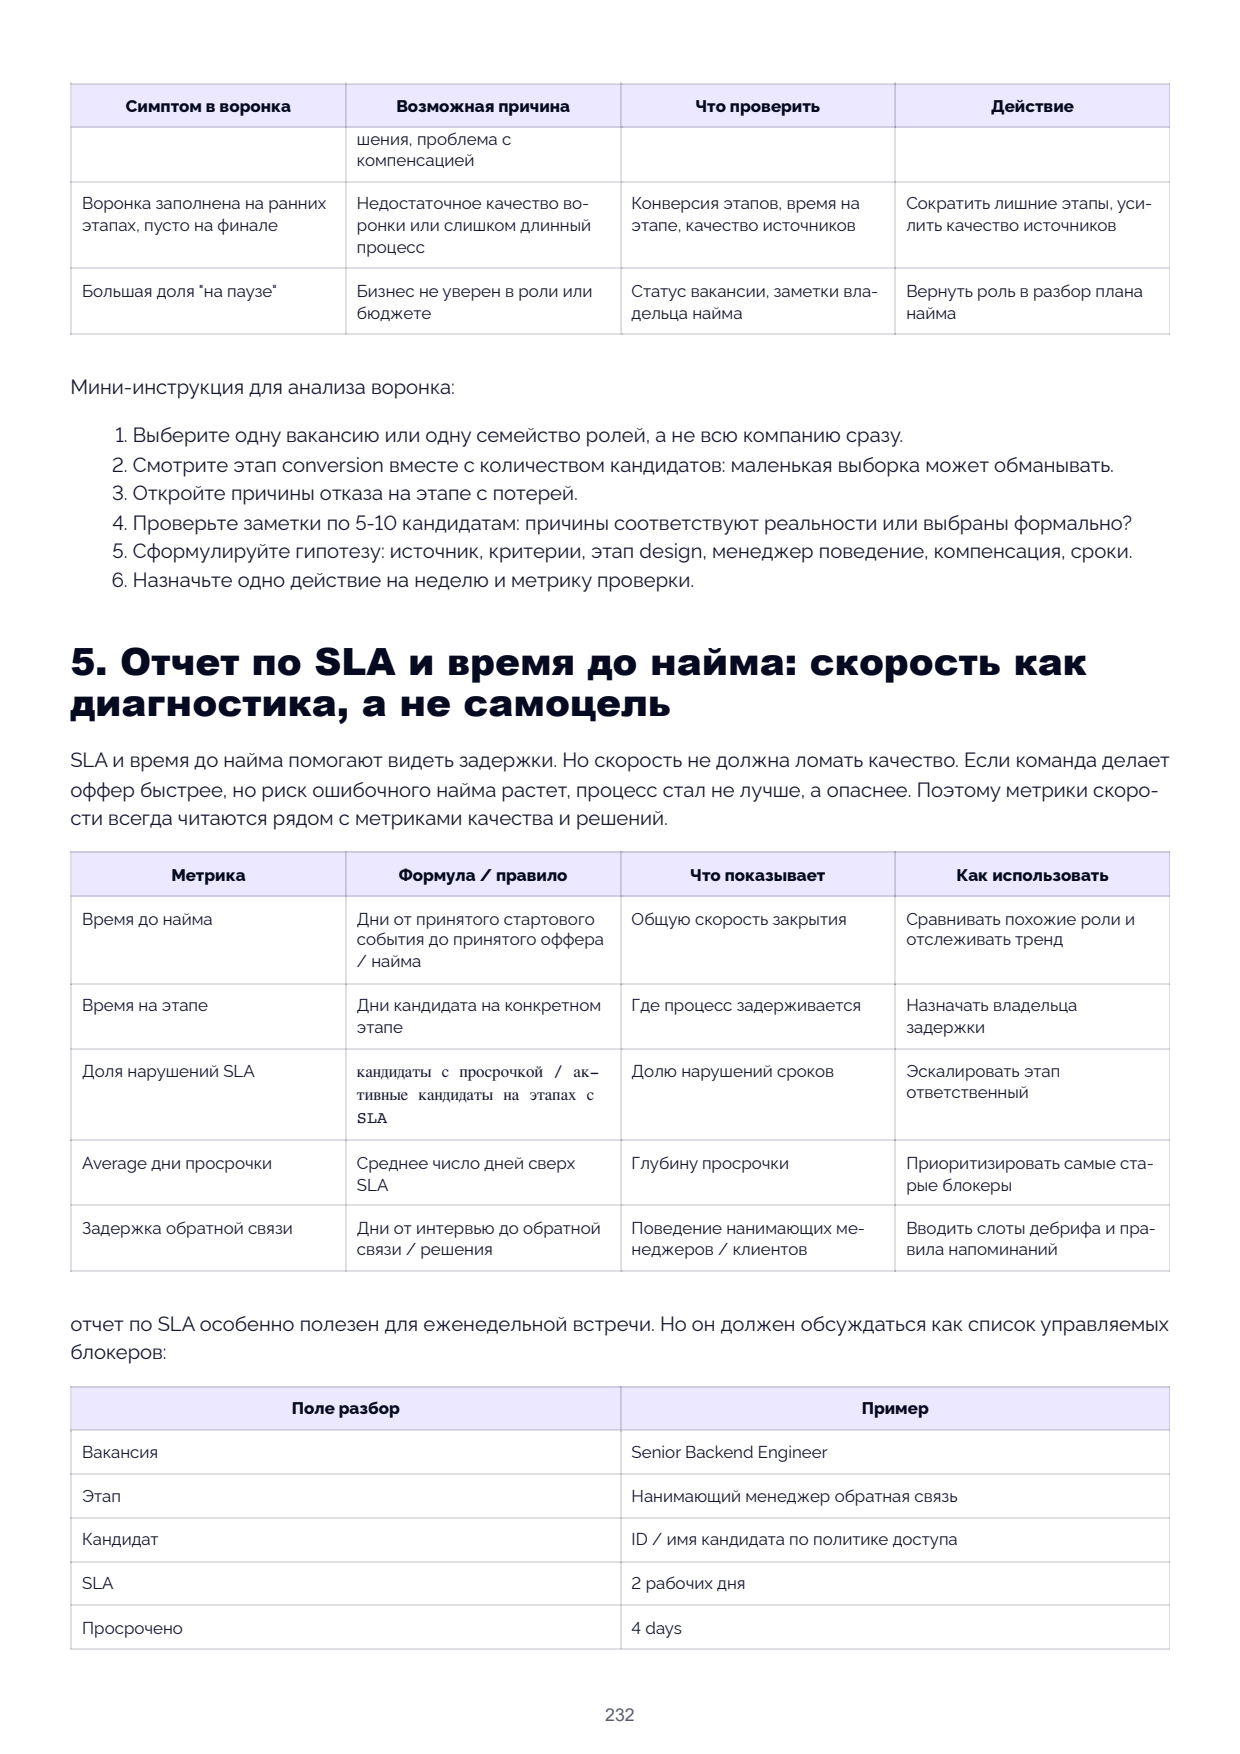
Symptom in funnel Possible cause What to check Action
Many candidates at entry, Source mismatch, weak Source report, screening Refine source strategy and
few pass screening vacancy description, too notes, rejection reasons must-have criteria
broad search
Many pass screening, few Screening does not check Notes, assessment card, Add targeted questions in
pass the manager interview key risks manager feedback screening
Candidates reach the final, Criteria shift at a late Rejection reports, offer notes, Rebuild decision rule and
but offers are rare stage, weak decision rule expectations on pay pre-conditions check
| Symptom in funnel | Possible cause | What to check | Action |
|---|---|---|---|
| rule, compensation issue | |||
| Funnel is full at early stages, empty at final | Insufficient funnel quality or process is too long | Stage conversion, time at stage, source quality | Remove unnecessary stages, strengthen source quality |
| Large share "on hold" | Business is unsure about the role or budget | Vacancy status, hiring owner notes | Return role to hiring plan review |
| Review field | Example |
|---|---|
| Responsible person | Hiring manager |
| Cause | Manager on leave, no backup assigned |
| Action | Lead assigns a reserve reviewer by 16:00 |
| Verification | Check at next weekly review |
6. Candidate movement: movement worth discussing
The candidate-movement report is needed for a factual conversation: which candidates entered, moved, reached the
final, were rejected, returned or stalled. It is useful as material for a meeting but dangerous as a "who moved the
most cards" metric. Movement without quality can mean chaos.
| What to look at | Management question | Good signal | Warning signal |
| Stage changes | Is the funnel moving? | Transitions are linked to decisions and notes | Cards move without assessment facts |
| Finalist movement | Are there real finalists? | Movement towards offer is confirmed by assessment cards | Finalists appear without unified criteria |
| Returned candidates | Why do candidates return? | Strong finalist or reactivation by rule | Returns without updated motivation |
| No movement on a vacancy | Where is the funnel frozen? | Low priority or role on hold | Active role with no movement and no action |
| Recruiter actions alongside movement | Are actions helping the process? | Actions are linked to next steps | Many actions but no stage progress |
For an agency, the candidate-movement report helps run a client meeting: not "we worked", but "here is what
happened with the funnel, here is where we need your feedback, here are the decisions blocking the shortlist".
7. Resume-source report: source quality instead of a volume race
You must not judge a source solely by the number of CVs. A good source may deliver fewer candidates but more
relevant screenings, final interviews, offers and hires. A poor source may fill the funnel, increase recruiter
workload and worsen candidate experience.
| Metric | Formula | What it shows | Limitation |
| Source volume | Candidates from source | Flow size | Does not show quality |
| Source → screening | Passed screening / source candidates | Initial fit | Depends on screening strictness |
| Source → interview | Reached interview / source candidates | Quality after recruiter review | Depends on manager criteria |
| Source → offer | Offers / source candidates | Strong quality signal | Small samples may distort |
| Offer acceptance by source | Accepted offers / offers by source | Motivation and process alignment | Depends on compensation and timelines |
| Metric | Formula | What it shows | Limitation |
|---|---|---|---|
| Rejection reason by source | Share of reasons by source | Type of mismatch | Requires clean taxonomy |
| Practical source review table: | |||
| Source | What we see | What to check | Decision |
| Job board delivers many inbound but low screening pass rate | Volume is high, quality is weaker | Vacancy description, must-have criteria clarity, salary transparency | Refine description and screening filters |
| Referral delivers few candidates but high final-stage conversion | Quality is high, volume is limited | Assessment fairness, source concentration, referral rules | Grow referrals without bypassing assessment cards |
| Direct outreach delivers low response but high interview pass rate | Difficult but quality channel | Message relevance, role attractiveness | Improve outreach and time allocation |
| Agency delivers strong finalists | External market access is working | Fee vs cost of unfilled vacancy, shortlist definition | Maintain the agreement and feedback SLA |
8. Rejection report: rejection reasons as a quality diagnosis
The rejection report is only useful with a clean reason taxonomy. If the team frequently selects "other",
"not a fit" or "weak", the report shows poor note discipline, not the market. A rejection reason must answer:
who ended the process, at which stage, due to which work-related factor or condition.
| Reason category | Examples | How to use |
| Company rejection: skills gap | No evidence of must-have skill criteria, weak case, insufficient domain depth | Improve sourcing, screening, assessment cards |
| Company rejection: role mismatch | Experience from a different role family, level did not match, expectations diverged | Refine role description and intake |
| Candidate rejection: compensation | Salary, bonus, options, benefits did not match expectations | Review pay band or pre-conditions check |
| Candidate rejection: process | Long wait, many stages, poor communication | Improve candidate experience and SLA |
| Candidate rejection: role / company | Uninteresting tasks, manager risk, work format mismatch | Improve realism of role description |
| Timelines | Notice period, availability, inability to start urgently | Plan the funnel earlier |
| Offer / counter-offer | Accepted another offer, stayed after counter-offer | Strengthen pre-conditions check and offer strategy |
| Consent / data limitation | Cannot use data or represent the candidate | Update the consent process |
Example review: if many candidates reject on compensation at the final stage, the problem is not recruiter
activity. You need to look at the pay band, expectation management, market data, pre-conditions check and offer
approval speed. If many company rejections cite "role mismatch" after the manager interview, you need to go
back to screening and intake.
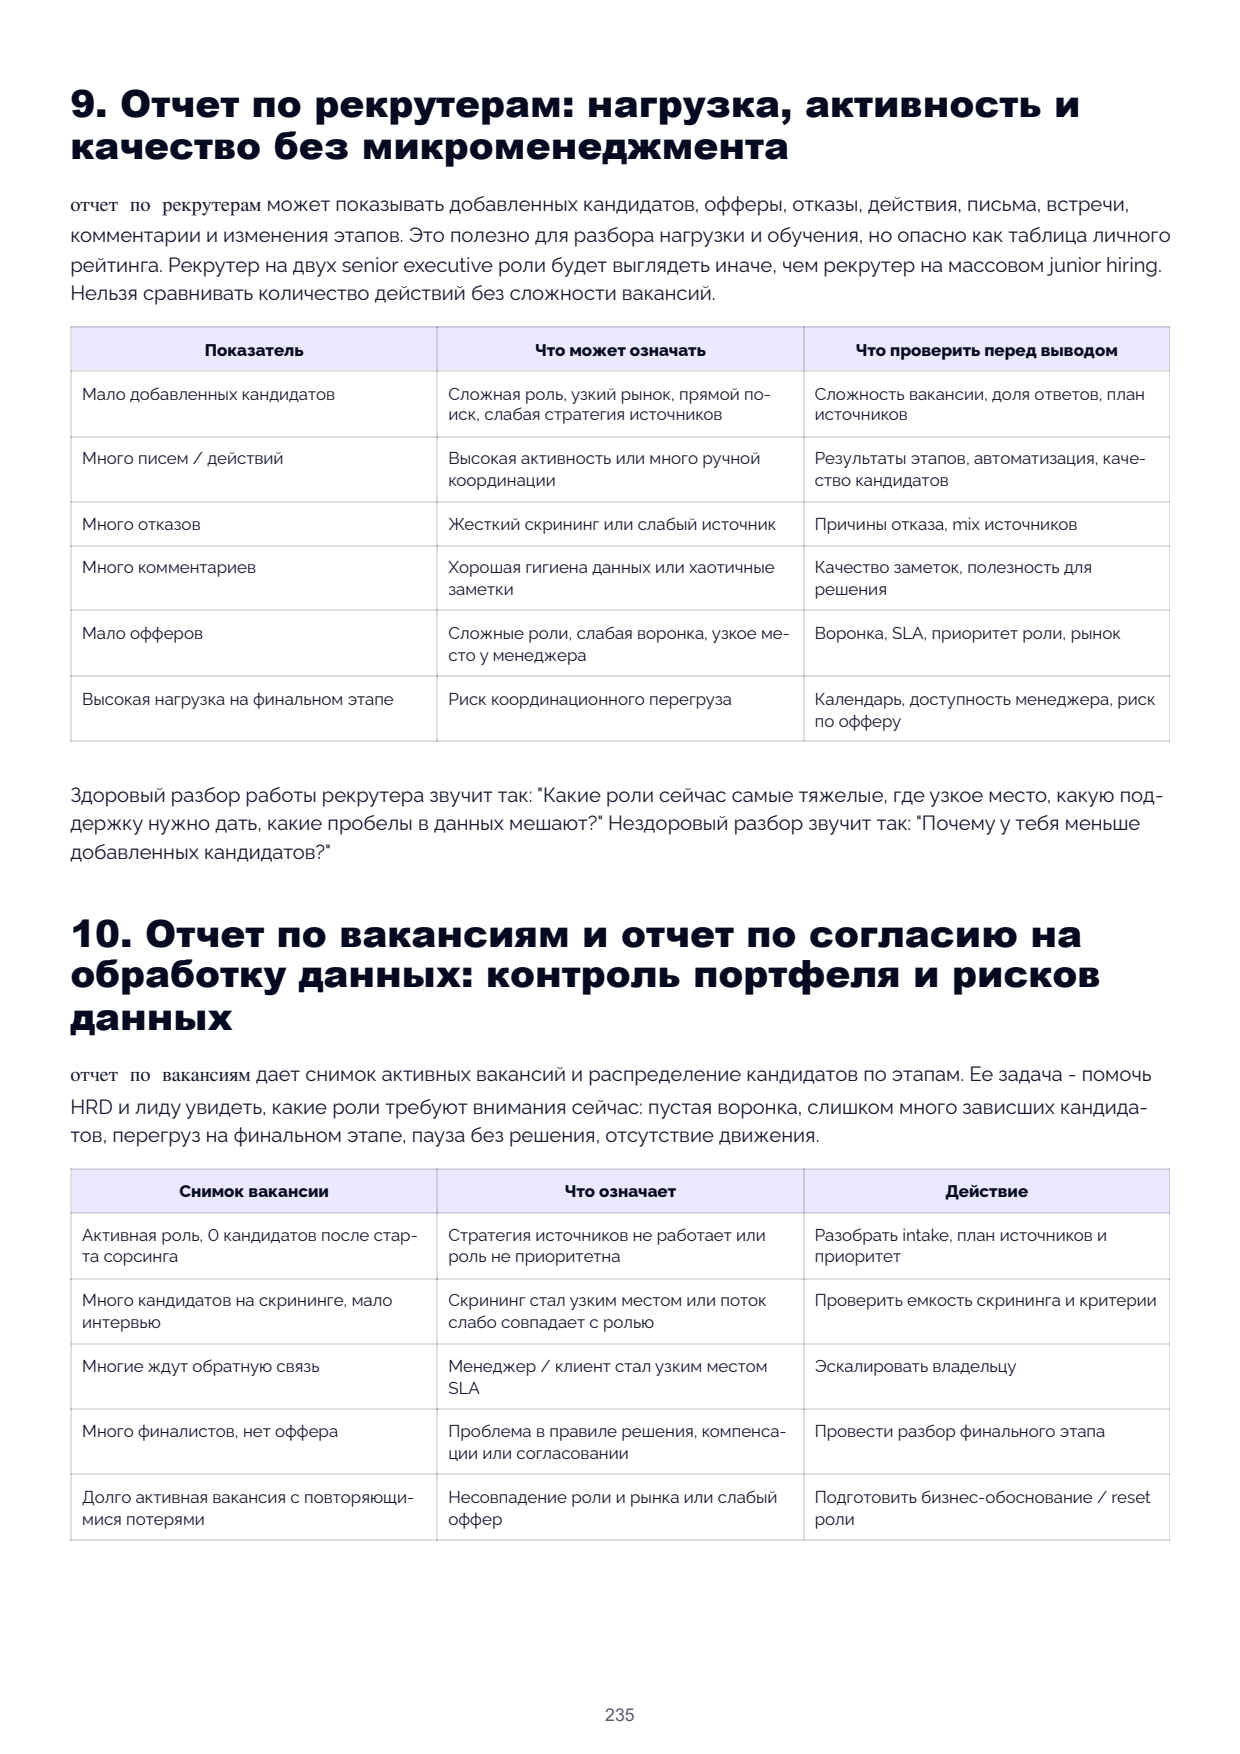
9. Recruiter report: workload, activity and
quality without micromanagement
The recruiter report can show added candidates, offers, rejections, actions, emails, meetings, comments and stage
changes. This is useful for workload review and training, but dangerous as a personal leaderboard table. A recruiter
on two senior executive roles will look very different from a recruiter on mass junior hiring. You must not compare
action counts without accounting for vacancy complexity.
Indicator What it may mean What to check before drawing conclusions
Few added candidates Complex role, narrow market, direct Vacancy complexity, response rate, source plan
search, weak source strategy
Many emails / actions High activity or lots of manual Stage results, automation, candidate quality
coordination
Many rejections Strict screening or weak source Rejection reasons, source mix
Many comments Good data hygiene or chaotic notes Note quality, usefulness for decisions
Few offers Complex roles, weak funnel, bottleneck Funnel, SLA, role priority, market
with the manager
High workload at final stage Coordination overload risk Calendar, manager availability, offer risk
A healthy recruiter work review sounds like: "Which roles are the heaviest right now, where is the bottleneck,
what support is needed, which data gaps are in the way?" An unhealthy review sounds like: "Why do you have fewer
added candidates?"
10. Vacancy report and data-consent report:
portfolio and data-risk control
The vacancy report provides a snapshot of active vacancies and candidate distribution across stages. Its purpose
is to help the HRD and lead see which roles need attention now: an empty funnel, too many stalled candidates,
overload at the final stage, a hold with no decision, no movement.
Vacancy snapshot What it means Action
Active role, 0 candidates after sourcing Source strategy is not working or Review intake, source plan and
the role is not a priority priority
Many candidates at screening, few interviews Screening has become the bottleneck or Check screening capacity and
the flow weakly matches the role criteria
Many awaiting feedback Manager / client has become the bottleneck Escalate to the owner
beyond SLA
Many finalists, no offer Problem with the decision rule, Run a final-stage review
compensation or approval
Long-active vacancy with repeated losses Role-market mismatch or weak Prepare business case / reset
offer role
The data-consent report is needed for operational control of personal data. It shows consent status, retention
periods, candidates without valid consent and bulk requests. This is not legal advice and not a replacement for
company policy, but the report helps the team avoid using data "from memory".
Consent signal Risk Action
Candidate without valid consent Cannot proceed under policy where Send consent request or suspend
consent is required use
Consent expiring soon Risk of losing future contact right Schedule renewal / deletion
review
Old warm pool without retention review Unmanaged database Run audit, archive, delete
or update
Bulk requests needed Risk of manual chaos Use approved template and
assign owner
11. Agency and in-house recruitment: one
analytics, different decisions
Agency and in-house recruitment teams look at similar reports but make different decisions.
Context What to look at Decisions Risk
Agency: delivery Shortlist conversion, client Refine client brief, protect fee, Client evaluates only CV
feedback SLA, source quality, change source strategy volume
candidate rejection reasons
Agency: account Vacancy priority, client Run reset with client, change Agency takes ownership of
management blockers, market feedback, expectations per agreement client bottleneck
rejection patterns
In-house recruitment Funnel, SLA, time-to-hire, Rebalance capacity, train Recruitment becomes a service
recruiter workload, manager managers, change process without influence
behaviour
HRD / leadership Vacancy portfolio, business Prioritisation, budget, policy, Too late to see systemic
priorities, cost of unfilled quarterly improvements risk
vacancy, consent risks
An agency report must show not just "how many candidates were sent" but process quality: criteria alignment,
assessment evidence in the shortlist, feedback discipline, source insights and offer risk. An in-house recruitment
report must show the business that hiring results depend not only on recruiters but also on hiring owners,
compensation, role clarity and decision speed.
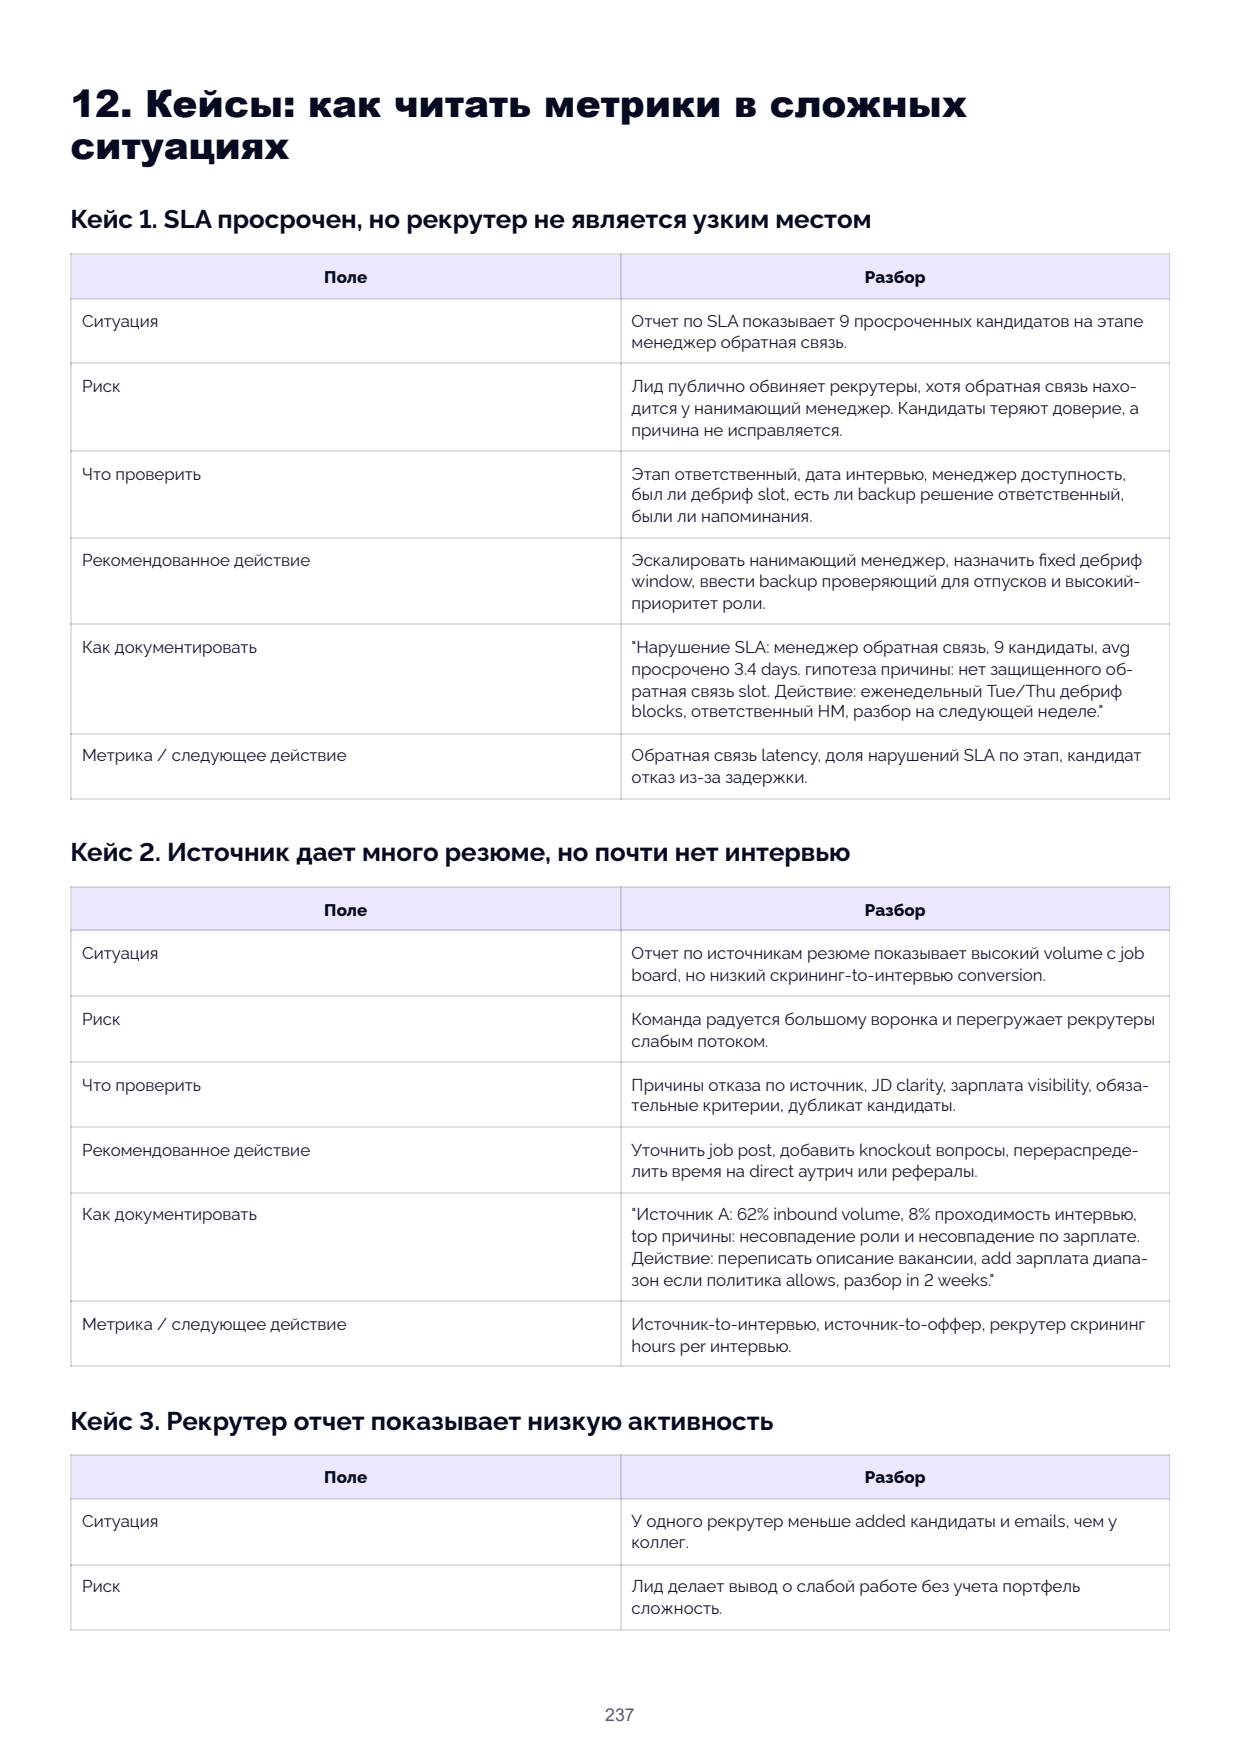
12. Cases: how to read metrics in difficult
situations
Case 1. SLA breached but the recruiter is not the bottleneck
Field Review
Situation The SLA report shows 9 overdue candidates at the manager
feedback stage.
Risk The lead publicly blames recruiters, although feedback sits
with the hiring manager. Candidates lose trust, and the cause
is not fixed.
What to check Stage owner, interview date, manager availability, whether
there was a debrief slot, whether a backup decision-maker
exists, whether reminders were sent.
Recommended action Escalate to the hiring manager, set a fixed debrief window,
introduce a backup reviewer for leave and high-priority roles.
How to document "SLA breach: manager feedback, 9 candidates, avg overdue 3.4
days. Hypothesis: no protected feedback slot. Action: weekly
Tue/Thu debrief blocks, owner is HM, review next week."
Metric / next step Feedback latency, SLA breach rate by stage, candidate
rejection due to delay.
Case 2. A source delivers many CVs but almost no interviews
Field Review
Situation The resume-source report shows high volume from a job
board but low screening-to-interview conversion.
Risk The team celebrates a large funnel and overloads recruiters
with a weak flow.
What to check Rejection reasons by source, JD clarity, salary visibility, must-
have criteria, duplicate candidates.
Recommended action Refine the job post, add knockout questions, reallocate time
to direct outreach or referrals.
How to document "Source A: 62% inbound volume, 8% interview pass rate, top
reasons: role mismatch and salary mismatch. Action: rewrite
vacancy description, add salary range if policy allows, review
in 2 weeks."
Metric / next step Source-to-interview, source-to-offer, recruiter screening
hours per interview.
Case 3. Recruiter report shows low activity
Field Review
Situation One recruiter has fewer added candidates and emails than
colleagues.
Risk The lead draws a weak-work conclusion without accounting for
portfolio complexity.
| Field | Review |
|---|---|
| What to check | Number of active vacancies, role maturity, market scarcity, final-stage workload, agency/client coordination, result quality. |
| Recommended action | Run a workload review: offload final-stage coordination, provide sourcing support or change priority list. |
| How to document | "Activity lower due to 3 senior roles, 11 final-stage interviews, high coordination load. Support: coordinator handles meeting planning; sourcer adds funnel for Role B." |
| Metric / next step | Stage conversion quality, final-stage movement, recruiter capacity, closure action rate. |
| Case 4. Rejection report filled with vague reasons | |
| Field | Review |
| Situation | 40% of rejections recorded as "other" or "not a fit". |
| Risk | The team cannot improve criteria, sources or candidate communication. |
| What to check | Reason taxonomy, mandatory comments, interviewer training, ATS fields, examples of good notes. |
| Recommended action | Update the reason dictionary, ban "other" without a comment, run a 30-minute calibration on 10 rejections. |
| How to document | "Vague rejection rate 40%. New rule: reason must link to criteria / candidate decision; 'other' requires a note. Audit next month." |
| Metric / next step | Vague reason rate, note quality, rejection reason distribution by stage. |
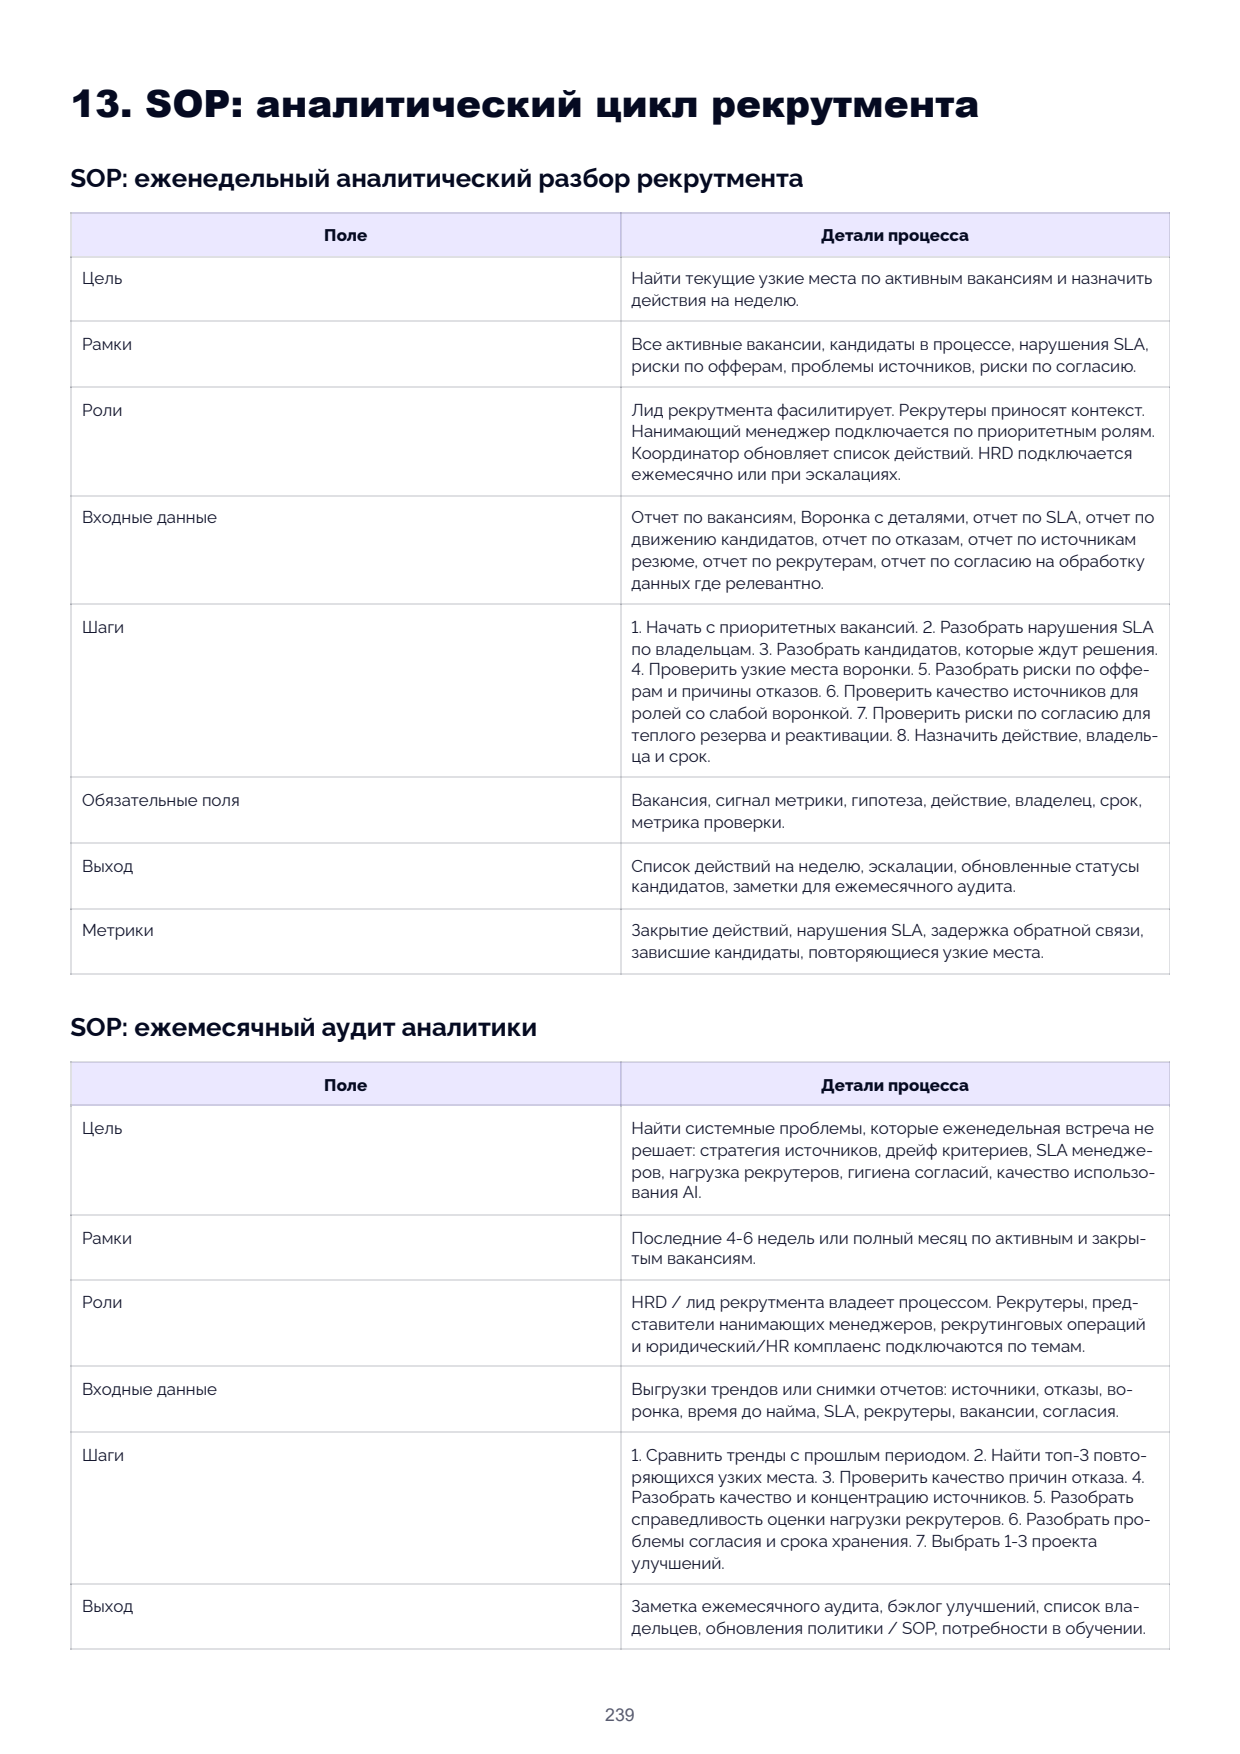
13. SOP: the recruitment analytics cycle
SOP: weekly recruitment analytics review
Field Process details
Purpose Identify current bottlenecks across active vacancies and assign
actions for the week.
Scope All active vacancies, candidates in process, SLA breaches,
offer risks, source issues, consent risks.
Roles The recruitment lead facilitates. Recruiters bring context.
The hiring manager joins for priority roles. The coordinator
updates the action list. The HRD joins monthly or for
escalations.
Inputs Vacancy report, funnel with details, SLA report, candidate-
movement report, rejection report, resume-source report,
recruiter report, data-consent report where relevant.
Steps 1. Start with priority vacancies. 2. Review SLA breaches by
owner. 3. Review candidates awaiting a decision.
4. Check funnel bottlenecks. 5. Review offer risks and rejection
reasons. 6. Check source quality for roles with weak funnels.
7. Check consent risks for the warm pool and reactivation.
8. Assign action, owner and deadline.
Mandatory fields Vacancy, metric signal, hypothesis, action, owner, deadline,
verification metric.
Output Weekly action list, escalations, updated candidate statuses,
notes for the monthly audit.
Metrics Action closure, SLA breaches, feedback delay, stalled
candidates, recurring bottlenecks.
SOP: monthly analytics audit
Field Process details
Purpose Identify systemic issues the weekly meeting does not resolve:
source strategy, criteria drift, manager SLA, recruiter workload,
consent hygiene, AI usage quality.
Scope The last 4–6 weeks or a full month across active and closed
vacancies.
Roles HRD / recruitment lead owns the process. Recruiters,
hiring-manager representatives, recruiting operations and
legal/HR compliance join by topic.
Inputs Trend exports or report snapshots: sources, rejections, funnel,
time-to-hire, SLA, recruiters, vacancies, consents.
Steps 1. Compare trends with the previous period. 2. Identify the top
3 recurring bottlenecks. 3. Check rejection reason quality. 4.
Review source quality and concentration. 5. Review recruiter
workload assessment fairness. 6. Review consent and retention
issues. 7. Select 1–3 improvement projects.
Output Monthly audit note, improvement backlog, owner list, policy /
SOP updates, training needs.
| Field | Process details |
|---|---|
| Metrics | Recurring bottlenecks, source-to-offer, vague reason rate, recruiter workload balance, valid consents, action closure. |
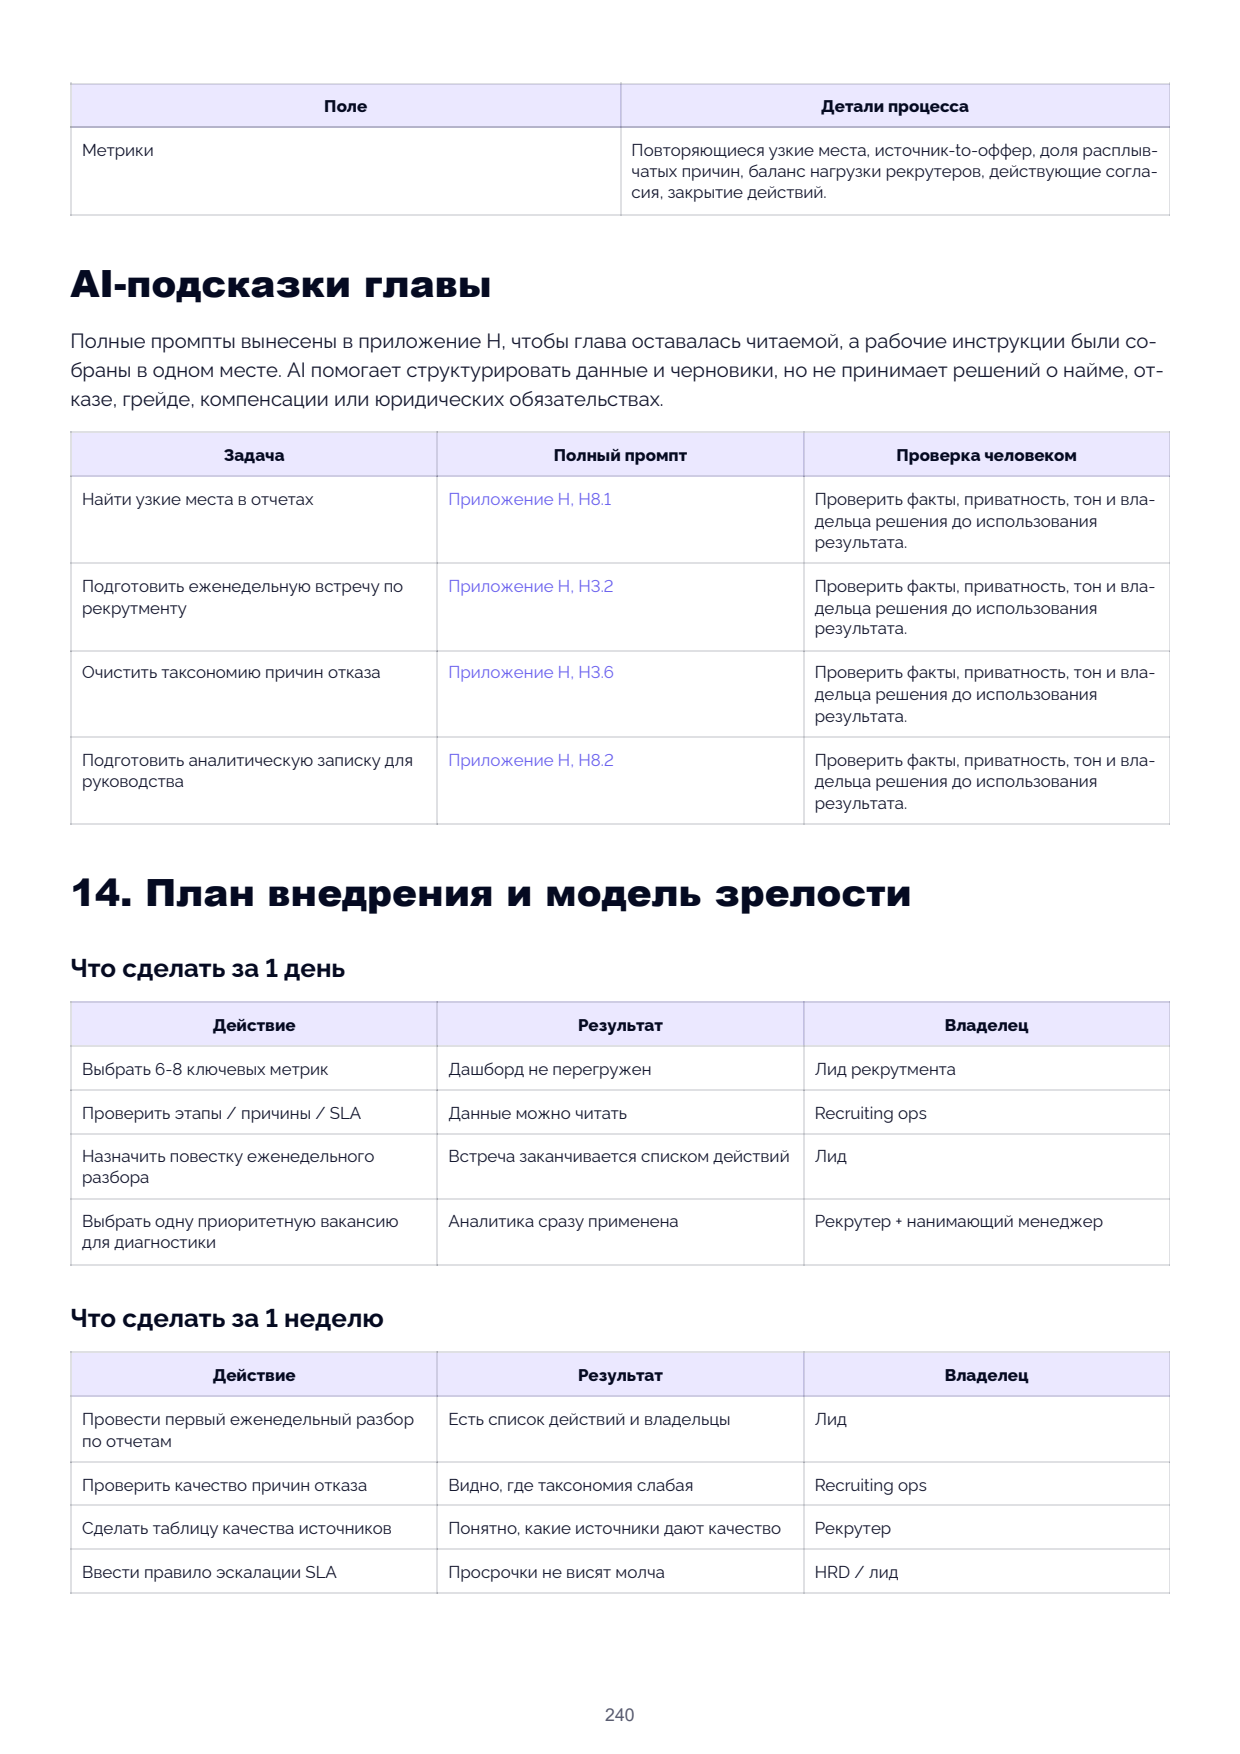
| Action | Result | Owner | |
|---|---|---|---|
| Check the data-consent report | Consent risk is now visible | HR / legal responsible person | |
| What to do in 1 month | |||
| Action | Result | Owner | |
| Run the monthly analytics audit | Recurring bottlenecks identified | HRD / lead | |
| Update SOP on reasons and SLA | Data quality improved | Recruiting ops | |
| Compare roles by complexity | Recruiter work review becomes fairer | Lead | |
| Prepare a business brief on priority bottleneck | Analytics is linked to business decisions | HRD | |
| Update AI prompts and review rules | AI helps without harm | Process owner | |
| Maturity model | |||
| Level | What analytics looks like | Risk | Next step |
| Chaos | Data is collected manually before a leadership request | Reports do not reflect the process | Set up stages, statuses, reasons and SLA |
| Managed process | There is a weekly dashboard and base reports | Meetings can become number-scanning | Add action owners and verification metrics |
| Data-driven | Process, capacity and budget decisions rely on trends | Numbers can be over-valued without context | Mandatory qualitative review |
| AI-assisted operations | AI prepares hypotheses, briefs and data-quality checks | AI can amplify bias or false confidence | Human review, audit notes, governance policy |
| What to take from this chapter / where to go next | |||
| What you need | Where to find it | ||
| Terms and short definitions | Appendix B. Mini glossary | ||
| Ready-made procedures and SLA | Appendix D. Ready-made procedures and processes | ||
| Templates for use | Appendix E. Template library | ||
| End-to-end BDM and Backend examples | Appendix F. End-to-end BDM and Backend cases | ||
| Full AI prompts for this chapter | Appendix H. AI prompt library, section H8. Analytics and economics |
What to take from this chapter / where to go next
What you need Where to find it
Terms and short definitions Appendix B. Mini glossary
Ready-made procedures and SLA Appendix D. Ready-made procedures and processes
Templates for use Appendix E. Template library
End-to-end BDM and Backend examples Appendix F. End-to-end BDM and Backend cases
Full AI prompts for this chapter Appendix H. AI prompt library, section H8. Analytics
and economics
In short: this chapter owns the metrics and analytics for HarmonyATS. If you need a ready-made artifact, take it
from the appendices and leave the application logic in the chapter.