Chapter 14. The Economics of Hiring


How to Use This Chapter
Working scenario. A CFO looks at the agency fee and says: "It's expensive. Let's wait or find something cheaper." The HRD
opens not a presentation about recruitment pain, but a concise picture of the role: a sales territory has been open for eight
weeks, the manager is closing deals themselves, some meetings are being rescheduled, the funnel is underperforming, and finalists are dropping out due
to delays. At this point, the conversation shifts. The question is no longer "why is recruitment asking for money" but "how much does
delay cost and which decision will restore business capacity."
What has actually broken here: hiring is discussed as a cost line, though an open role already affects
speed, quality, clients, management time, and the risk of a bad hire. The economics of hiring are not about turning people into numbers. They exist to show the business the cost of delay, the cost of a poor decision, and the impact
of a correctly filled role.
In this chapter, financial models are used carefully: as a way to choose an action, not as a promise
of ROI. The term "role economics" describes the hiring impact model, not a valuation of a candidate's human worth.
If, in a working conversation, the wording starts to sound like "price tag on a person," replace it with more precise
language: hiring impact, cost of a bad hire, value of filling a role, the role's impact on the business.
Read this chapter as a toolkit for business conversations. If you need to defend a budget quickly, start with sections 2, 3
and 8. If you need to explain to the CEO why a vacancy cannot simply be "waited out," go to the cost of an unfilled
vacancy. If you need to justify an agency fee, look at the agency economics sections. If you need to build
a management dashboard, use the HarmonyATS block and the metrics table.
Remember in one phrase: cheap hiring can be expensive if you count not just the invoice, but the delay.
| If your task is | Go to section | What you'll get |
|---|---|---|
| Explain how hiring affects the bottom line | 1 | A simple model for capacity, revenue, risk, and quality |
| Calculate the cost of hiring | 2 | Hiring cost and cost components |
| Show the price of an unfilled vacancy | 3 | Cost of an unfilled vacancy by role type |
| Justify the quality of assessment | 4 | Cost of a bad hire and risk of a poor decision |
| Explain role economics | 5 | Role economics without dehumanisation |
| Defend a budget or agency contract | 8 | Business case template |
| Set up analytics | 9–10 | Metrics, HarmonyATS reports, decision dashboard |
| Prepare a conversation with the CEO / CFO | 12 | Case studies and ready-made wording |
| Use AI | 13 | Prompts with human oversight |
| Create a procedure | 14–15 | SOP, checklist, maturity model |
Quick Chapter Map
| Model | Key Question | Where to Get Data | How to Use It |
|---|---|---|---|
| Cost of Hiring | How much does it cost to fill a role? | Finance, payroll system, recruiter time, hiring manager time, agency invoices, tools, assessment, onboarding | Compare channels, roles, processes, and investments |
| Cost of an Unfilled Vacancy | What does the business lose while the role is open? | Revenue model, delivery plan, support workload, roadmap, SLA, manager estimates | Prioritise vacancies and accelerate bottlenecks |
| Cost of a Bad Hire | How much does a hiring mistake cost? | Hire cost, salary, time to reach productivity, performance gap, re-filling the position, client / team impact | Justify assessment, calibration, probation, and onboarding |
| Role Economics | What long-term impact does a correctly filled role deliver? | Expected contribution, tenure, time to productivity, retention, risk, process cost | Defend hiring quality, onboarding, and workforce policy |
| Referral ROI | What do referrals add beyond speed? | Referral spend, conversion, quality, retention, diversity / assessment fairness review | Tune the referral programme without closing off the network |
| Agency ROI | What does the client get from an agency beyond a CV? | Vacancy cost, shortlist quality, time saved, re-filling risk, market feedback | Justify fees and the engagement format |
Minimum Starting Point
The economics of hiring are only useful when assumptions are visible and open to discussion.
| Step | Action | Artifact |
|---|---|---|
| 1 | For one role, estimate the cost of filling, the cost of delay, and the risk of a bad hire | Economics snapshot |
| 2 | Separate hard data from assumptions with ranges | Assumption table |
| 3 | Show what decision is required from the business: priority, budget, range, stages, or resources | Decision request |
| 4 | Do not use the financial model as an ROI promise; use it as a way to choose an action | Cautious business case |
1. Hiring as a Business Mechanism, Not an Administrative Function
In a mature company, recruitment is not just about "filling vacancies." It manages the business's access to the right working capacity. When a role is filled correctly, the company gains the ability to sell, implement, develop, support clients, manage finances, lead teams, or launch new directions. When a role remains unfilled, the business is not simply waiting for a person. It pays a hidden cost: projects slip, managers pick up extra work, clients receive weaker service, the team burns out, and decisions are made more slowly. Therefore, the economic conversation about hiring does not start with the recruitment budget. It starts with a question: what capability should this role create for the company?
| Role | Capacity Created | What Happens Without the Role | How It Shows in the Business |
| Sales Manager | Funnel, new deals, coverage of revenue plan | Sales plan depends on fewer people; the manager closes deals themselves | Funnel gaps, missed meetings, lower territory coverage |
| Customer Success Manager | Retention, adoption, renewals, client trust | Clients receive less attention; churn risks are noticed too late | Rising escalations, falling adoption, renewal risk |
| Engineer | Product delivery, reliability, roadmap speed | Roadmap slows, tech debt grows, incidents take longer to resolve | Delayed releases, incident backlog, overtime |
| Finance Analyst / Controller | Control, reporting, risk visibility | Managers make decisions on weak data; errors accumulate | Late period close, manual errors, poor cash flow visibility |
| Recruiter | Hiring capacity and process control | Hiring managers run chaotic processes themselves; candidates wait | SLA breaches, lost candidates, weak funnel |
| Team Lead / Manager | Coordination, priorities, people decisions | Strong specialists spend time on coordination; conflicts go unresolved | Decision latency, turnover risk, reduced team speed |
| Level | Weak Version Sounds Like | Strong Version Sounds Like |
|---|---|---|
| Financial | "The agency is expensive" | "The agency fee is lower than the estimated cost of an unfilled vacancy over 3–5 weeks for this sales role. If the agency shortens time-to-shortlist and improves shortlist quality, the fee is economically justified." |
| Strategic | "Hiring affects the business" | "Workforce policy affects growth speed: hiring quality, time to productivity, retention, and internal mobility determine how quickly the company turns plans into results." |
The economics of hiring need not be accurate to the last pound. They must be honest, verifiable, and useful for decision-making. It is better to have an approximate estimate with clear assumptions than not to discuss the cost of delay and error at all.
2. Cost of Hiring: How Much It Really Costs to Fill a Role
The cost of hiring is the full management cost of filling a role. Most teams make the mistake of counting only external payments: job posting, agency fee, advertising, tools. But for the business, internal time is often more expensive: the recruiter, hiring managers, interviewers, coordination, legal and financial approvals, onboarding, and time to productivity. The basic formula:
Cost of Hiring = external costs + cost of internal time + tools + assessment cost + offer administration + onboarding and time to productivity
Start with a simple version: hiring cost = direct recruitment spend + estimated number of internal hours × hourly cost + onboarding cost.
What to Include in the Cost of Hiring
| Component | What It Covers | How to Estimate Quickly | Common Mistake |
|---|---|---|---|
| Recruiter Time | Sourcing, coordination, screening, communication, meeting scheduling, notes, reporting | Recruiter hours × fully loaded hourly cost | Counting recruiter work as free because they are in-house |
| Hiring Manager Time | Role briefing, interviews, feedback, debrief, offer decision | Manager hours × hourly cost | Failing to account for the manager being pulled away from sales, product, or team management |
| Interviewer Time | Technical or functional interviews, scorecards, debrief | Number of interviews × average duration × hourly cost | Multiplying only by meeting time and forgetting preparation and notes |
| External Costs | Agency, job boards, advertising, assessment providers, background checks | Invoices / planned expenditure | Comparing the agency fee without accounting for speed and quality |
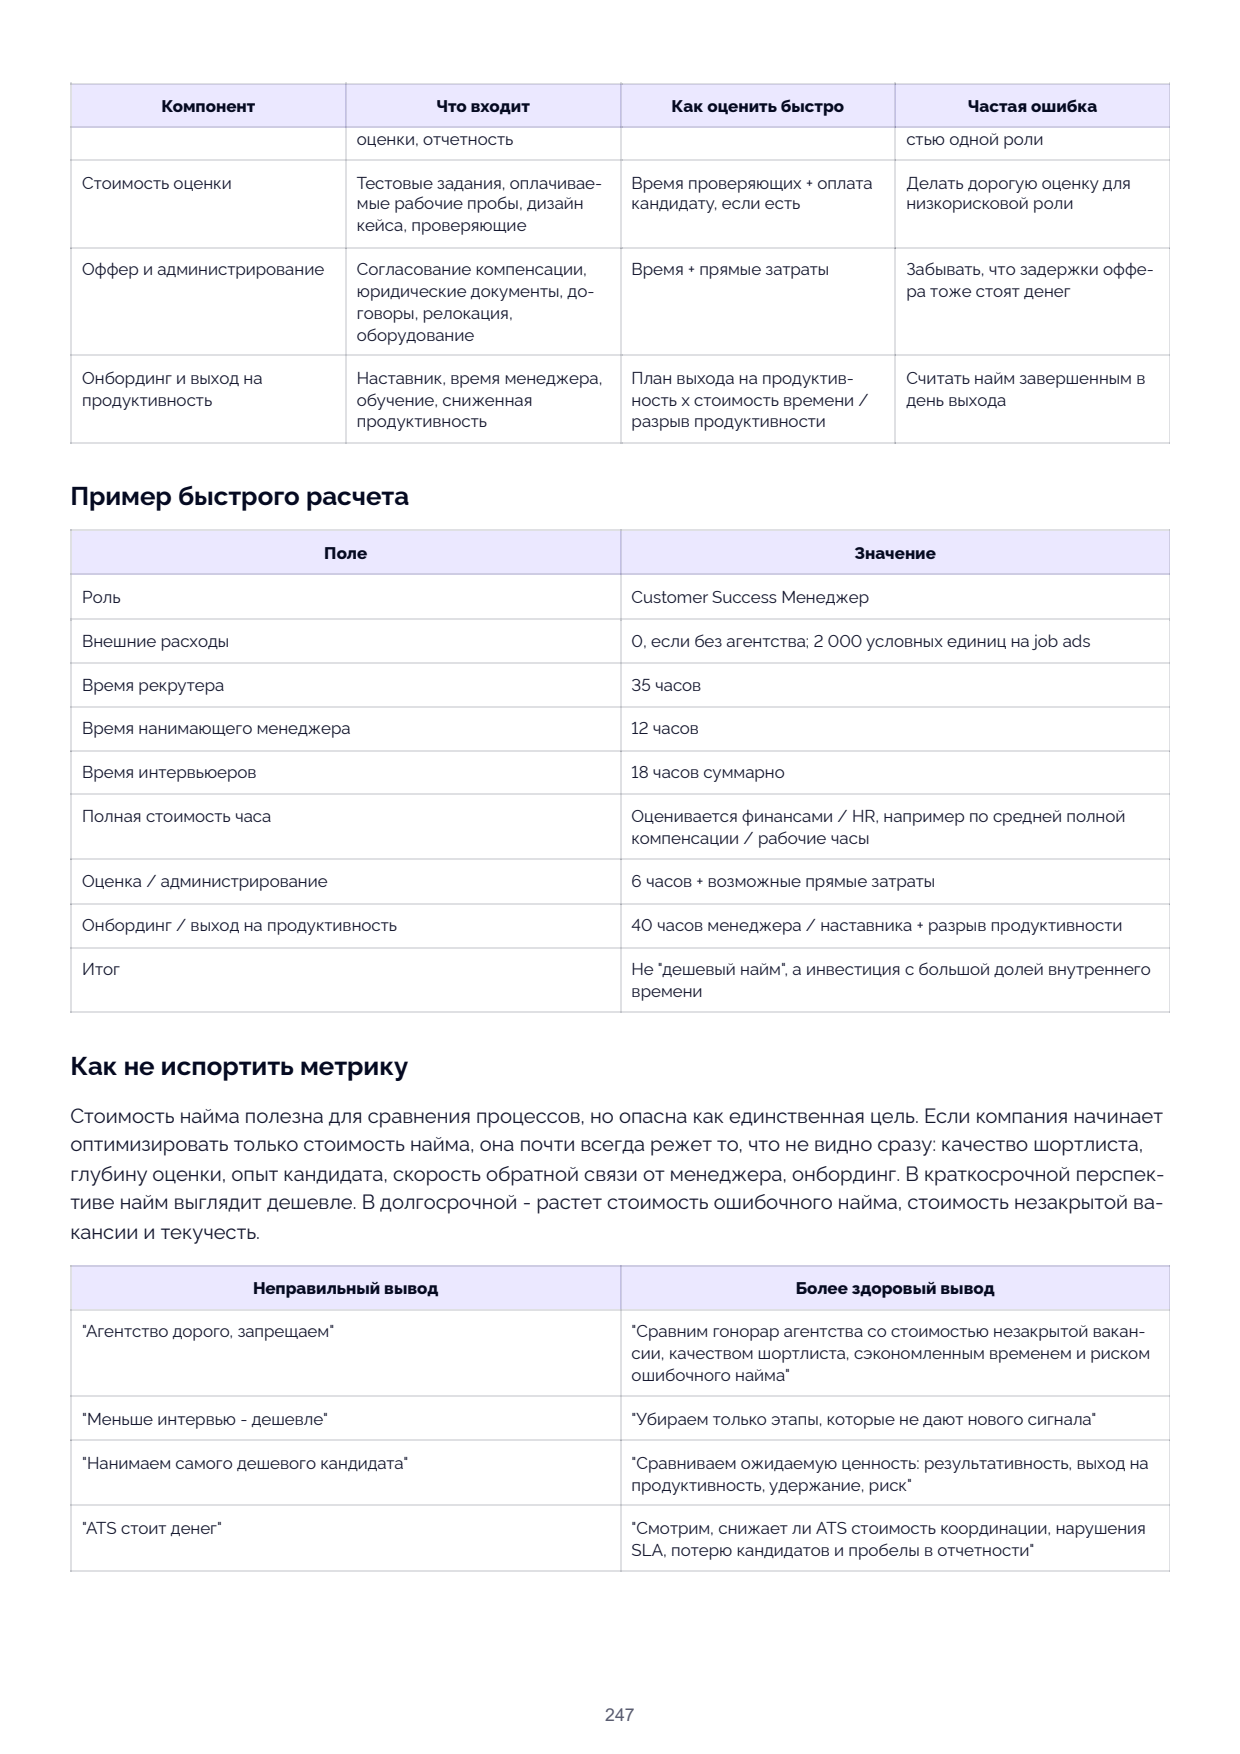
| Tools | ATS, scheduling, AI tools, platforms | Share of tool cost per hire or per vacancy | Charging the full annual tool cost against a single role |
| Assessment Cost | Test tasks, paid work trials, case design, assessors | Assessor time + candidate payment, if applicable | Running expensive assessment for a low-risk role |
| Offer and Administration | Compensation sign-off, legal documents, contracts, relocation, equipment | Time + direct costs | Forgetting that offer delays also cost money |
| Onboarding and Time to Productivity | Mentoring, manager time, training, reduced productivity | Time-to-productivity plan × time cost / productivity gap | Counting the hire as complete on their start date |
Quick Calculation Example
| Field | Value |
|---|---|
| Role | Customer Success Manager |
| External Costs | 0 if no agency; 2,000 units on job ads |
| Recruiter Time | 35 hours |
| Hiring Manager Time | 12 hours |
| Interviewer Time | 18 hours total |
| Fully Loaded Hourly Cost | Estimated by Finance / HR, e.g. based on average total compensation ÷ working hours |
| Assessment / Administration | 6 hours + possible direct costs |
| Onboarding / Time to Productivity | 40 hours of manager / mentor time + productivity gap |
| Result | Not "cheap hiring" but an investment with a large share of internal time |
3. Cost of an Unfilled Vacancy: The Price of an
Open Role
The cost of an unfilled vacancy is an estimate of what the business loses while the role remains open. This is not accountancy-
level precision. It is a management model that helps prioritise vacancies and explain why
delay is sometimes more expensive than investing.
Basic formula:
Cost of an Unfilled Vacancy = estimated business impact per period × time the role is open
For different roles, impact is calculated differently.
Role Type How to Assess Business Impact Example of a Cautious Formula What to Check
Sales Lost funnel, unreached quota, Monthly quota × estimated gap in open vacancy months
delayed deals performance × months the
vacancy is open and quota
Customer Success Churn risk, weaker adoption, ARR at risk × cautious estimate of the role's Which client portfolios are
delayed renewals, client portfolios impact × months the vacancy is actually without an owner and
without an owner open are there risk signals
Delivery / Implementation Delayed projects, penalties, Deferred project margin + overtime + client risk Can work be redistributed
backlog, overtime without losing quality
Engineering / Product Roadmap slippage, incidents, Cost of the delayed release or cost of a Is there a critical path or does
tech debt, opportunity cost workaround the role block a release
Finance / Operations Errors, late reporting, weak Cost of errors + cost of delay + additional Are there recorded incidents
controls, manual work manual hours or period-close delays
Leadership Slow decisions, founder / director Diverted manager hours + decision delays + What decisions are not being
overload, team turnover risk turnover risk made without the role
Recruiter Low hiring capacity, manager Cost of priority vacancies × delay due to Is the bottleneck genuinely in
overload, lost candidates insufficient recruitment capacity recruitment capacity
Confidence Levels
The cost of an unfilled vacancy is best presented with a confidence level. This is more honest and mature than a single
polished figure.
Confidence When to Use How to Phrase It
High There is a quota, SLA, contract penalties, backlog, "The estimate is based on quota / ARR / contract
measurable delay data. Range: X–Y per month."
Medium There is management data but the impact is "The estimate is based on manager assessment and
partly indirect historical conversion. Review needed
in 4 weeks."
Low Data is limited but the business risk is clear "This is a cautious hypothesis for prioritisation,
not a financial forecast."
How to Calculate Without False Precision
Do not try to turn every role into an exact monetary calculation. Sometimes the economic impact is better shown
through capacity units:
If money is hard Use a proxy
to quantify
Role affects team speed Story points / delayed projects / cycle time
Role affects service SLA breaches / escalations / backlog age
quality
Role affects control Late reports / manual errors / audit findings
Role affects Diverted manager hours / decision delays / management overload
management
Role affects Offer rejections due to delay / candidate drop-off / feedback delays
candidate pipeline
Example: Sales Role
Field Example
Role Account Executive
Monthly quota 100,000
Expected quota achievement in first months 0% while the vacancy is open; time to productivity after
hiring is counted separately
Duration of open vacancy 2 months
Hypothesis for cost of unfilled vacancy Up to 200,000 in deferred quota coverage, though this does
not equate to guaranteed lost revenue
Confidence Medium if there is territory demand and pipeline; low if
the quota is conditional
Decision If the agency shortens the time-to-fill by 3–4 weeks and
delivers acceptable shortlist quality, the fee may be
economically justified
Example: Finance Controller
Field Example
Role Finance Controller
Business Impact Late period close, manual reconciliation, poor cash flow
visibility
Financial Proxy Additional finance team hours + risk of incorrect
management decisions + delayed reporting
Hypothesis for cost of unfilled vacancy Not an exact "lost revenue" figure but the cost of risk
management
Confidence Medium if there is late-close history and error log
Decision Role priority is high even though it does not directly generate
revenue
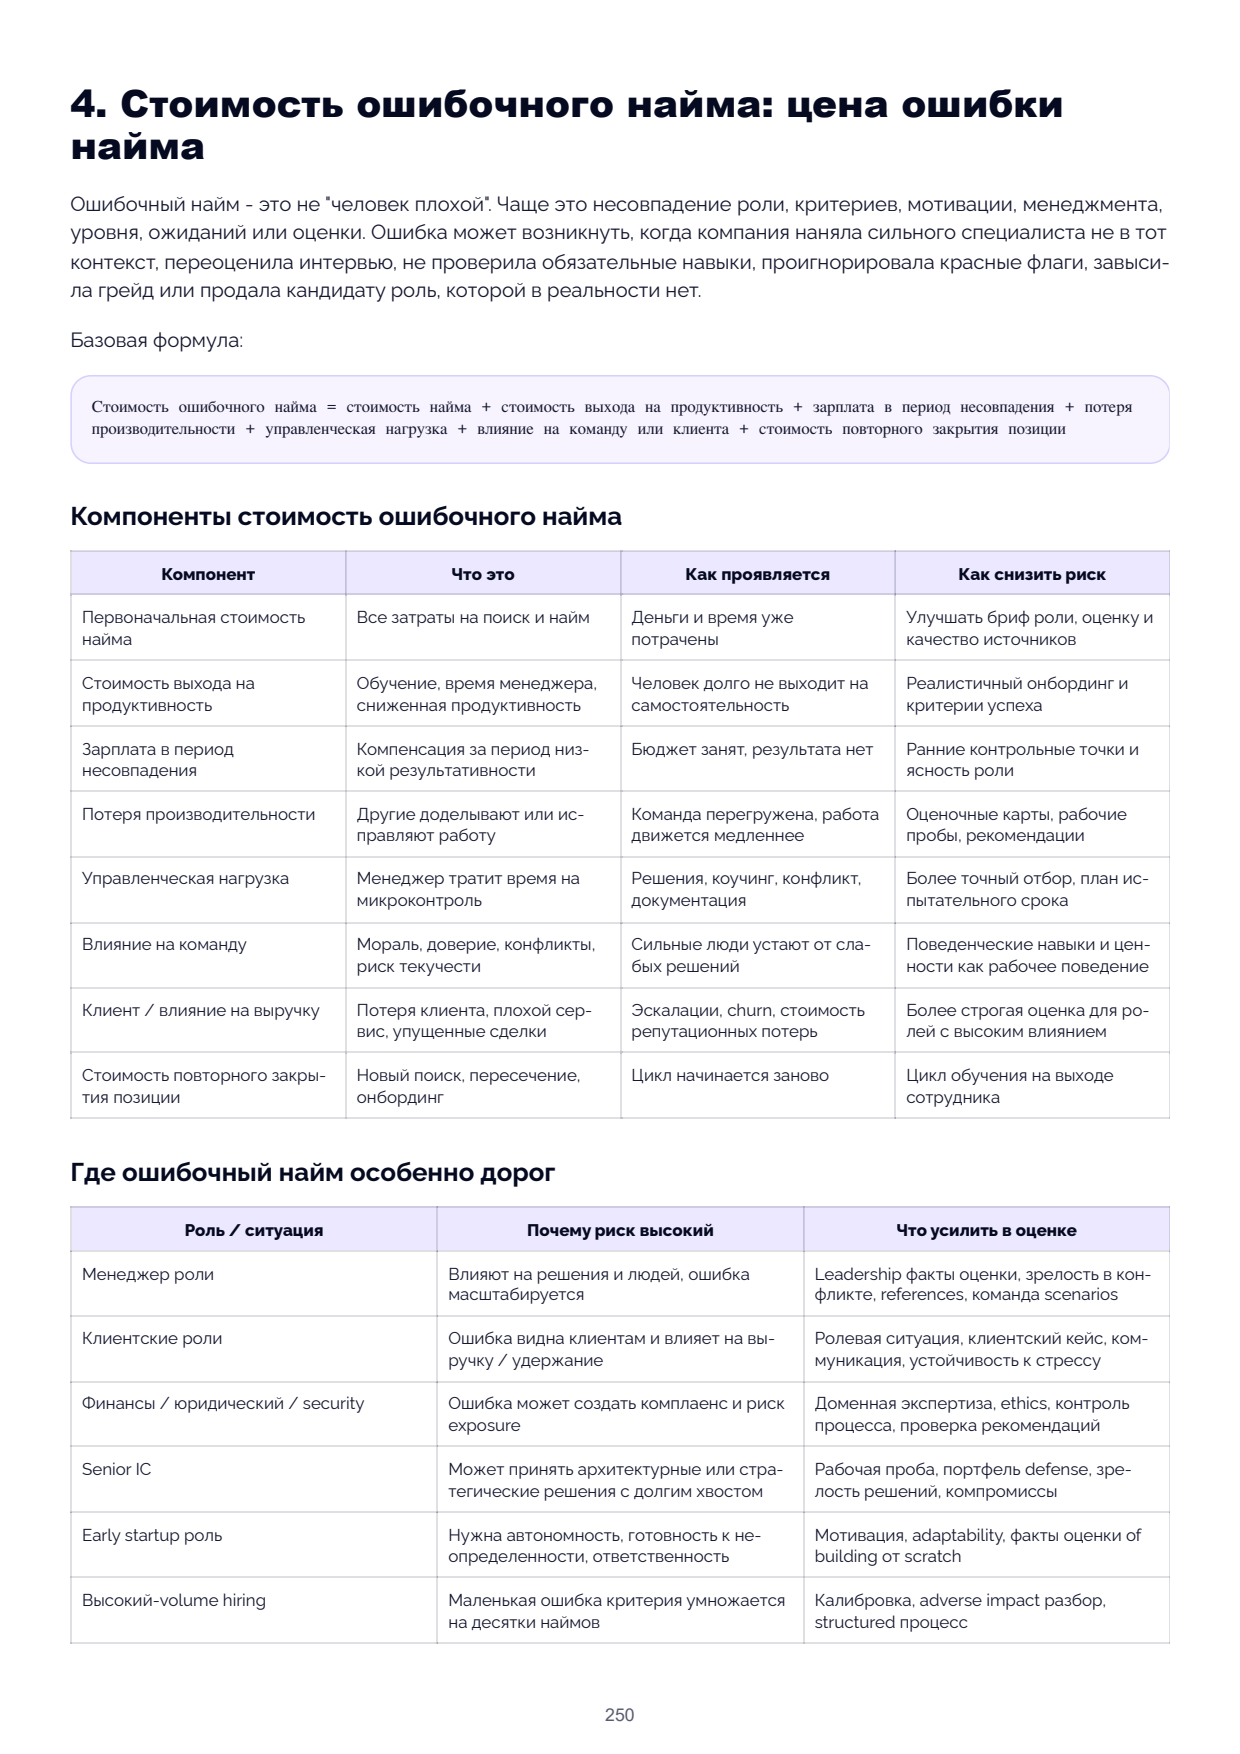
4. Cost of a Bad Hire: The Price of a
Hiring Mistake
A bad hire is not "a bad person." More often it is a mismatch of role, criteria, motivation, management,
level, expectations, or assessment. The error can arise when the company hires a strong specialist into the wrong
context, overvalues an interview, does not check mandatory skills, ignores red flags, over-grades,
or sells the candidate a role that does not exist in reality.
Basic formula:
Cost of a Bad Hire = hiring cost + time to productivity cost + salary during the mismatch period + loss
of productivity + management overhead + team or client impact + cost of re-filling the position
Components of the Cost of a Bad Hire
Component What It Is How It Manifests How to Reduce Risk
Initial Hiring Cost All search and hiring expenditure Money and time already Improve role briefing, assessment,
spent and source quality
Time to Productivity Training, manager time, reduced Person takes a long time to reach Realistic onboarding and success
productivity independently criteria
Salary During Mismatch Pay for the low-performance period Budget is occupied, no results Early checkpoints and role clarity
Loss of Productivity Others finish or fix the work Team is overloaded, work moves Assessment scorecards, work
more slowly trials, references
Management Overhead Manager spends time on micro- Decisions, coaching, conflict, More precise selection, probation
management documentation period plan
Team Impact Morale, trust, conflicts, turnover Strong people tire of weak Behavioural skills and values as
risk decisions working behaviours
Client / Revenue Impact Client loss, poor service, Escalations, churn, reputational Stricter assessment for high-impact
missed deals loss cost roles
Cost of Re-filling the New search, overlapping staff Onboarding cycle starts again Exit learning cycle
Position
Where a Bad Hire Is Particularly Costly
Role / Situation Why Risk Is High What to Strengthen in Assessment
Managerial Role Affects decisions and people; error Leadership assessment facts, conflict
scales up maturity, references, team scenarios
Client-Facing Role Error visible to clients and affects Role-play scenario, client case, communication,
revenue / retention stress tolerance
Finance / Legal / Security Error can create compliance and risk Domain expertise, ethics, process control,
exposure reference checks
Senior IC May make architectural or strategic Work trial, portfolio defence, decision maturity,
decisions with long tails trade-offs
Early Startup Role Needs autonomy, readiness for Motivation, adaptability, assessment facts for
uncertainty, accountability building from scratch
High-Volume Hiring Small criteria error multiplied across Calibration, adverse impact review,
dozens of hires structured process
Practical Rule
The higher the cost of a bad hire, the stronger the assessment must be. But "stronger" does not mean "longer." It
means: more task-linked assessment facts, better scorecards, clearer threshold criteria,
fewer vague opinions, faster debrief, more honest onboarding.
Cost of Error Sufficient Approach
Low Structured screening + one practical interview + clear onboarding
Medium Scorecard, structured interview, case / work trial, debrief
High Multi-method assessment, calibrated interviewers, reference checks,
role realistic preview, documented decision
5. Role Economics: The Long-Term Impact of Hiring
Without Dehumanisation
Role economics is a model of the long-term impact of a correctly filled role. It helps demonstrate that
hiring quality affects not just the current vacancy but also future productivity, retention, development,
internal mobility, client experience, and decision-making culture.
Formula:
Role Economics = expected contribution over tenure − acquisition cost − onboarding and time to productivity
• cost of process management − attrition risk adjustment
This formula must not be used as a "price tag on a person." It describes the economics of the role and hiring decisions,
not the human value of the candidate.
What Makes Up Role Economics
Element What It Means Practical Thinking
Expected Contribution What result can the person create Revenue, margin, delivery, reduced risk,
over their tenure process improvement, leadership capacity
Tenure How long the person is likely to be Do not guess; look at motivation alignment,
in the role or company role realism, growth plan, retention data
Acquisition Cost Hiring cost The more expensive the hire, the more
important decision quality and retention
Onboarding / Time to Productivity Time to productivity Good onboarding improves role economics
as much as good sourcing
Management / Process Cost How much management the result A strong hire reduces coordination cost;
requires a weak one increases it
Attrition Risk Adjustment Risk of early departure or mismatch Motivation, compensation alignment,
manager alignment, role honesty
| Role Economics by Role Type | ||
|---|---|---|
| Role Type | How Role Economics Are Created | What Can Destroy Role Economics |
| Sales | Deals, funnel training, market feedback, account expansion | Slow time to productivity, weak qualification, quick churn, mis-sold role |
| Customer Success | Retention, product adoption, expansion, client intelligence | Overload, weak escalation handling, poor context handover |
| Engineering | Product delivery, quality, technical leverage, mentoring | Wrong level, tech debt, poor collaboration, architecture mistakes |
| Marketing | Demand, positioning, experiments, market learning | Vanity metrics, weak analytics, poor ICP understanding |
| Finance | Control, decision quality, reduced risk, planning | Late data, manual errors, weak business partnership |
| Recruitment | Hiring capacity, hiring quality, manager discipline, candidate experience | Activity without quality, poor intake, weak analytics |
| How to Use Role Economics in Business Conversations | ||
| Situation | Weak Argument | Strong Argument |
| Need budget for assessment | "It will be higher quality" | "For this role, the cost of a bad hire is high. An additional work trial costs less than a single senior manager mis-hire." |
| Need a higher pay range | "The market is expensive" | "The current range reduces qualified candidate flow and stretches vacancy duration. The cost of an unfilled vacancy over 2 months exceeds the compensation gap." |
| Need dedicated onboarding | "New hires need support" | "Ramp-up directly affects role economics. If we cut time-to-productivity by 3 weeks, the role starts generating capacity sooner." |
| Need referrals | "Referrals are faster" | "A referral programme can reduce time-to-trust and improve conversion, but we will monitor quality, retention, and assessment fairness." |
6. Agency Economics: How Agencies Can Demonstrate Value
A recruitment agency often loses the economic conversation when it sells "CVs" rather than business outcomes. The client sees the fee and compares it with an in-house recruiter or a job board. A strong agency explains differently: the fee pays for speed, market access, shortlist quality, qualification, reduced management overhead, market feedback, and lower cost of an unfilled vacancy.
What the Agency Actually Sells
| Value Level | What the Client Gets | How to Prove It |
|---|---|---|
| Speed | Faster shortlist / interviews / offer | Time-to-shortlist, time-to-interview, SLA adherence |
| Quality | Fewer irrelevant candidates, stronger criteria alignment | Shortlist acceptance rate, interview pass-through, reasons for rejection |
| Market Intelligence | Understanding of compensation, objections, availability, and criteria realism | Weekly market notes, reasons for rejection, salary expectations |
| Process Discipline | Client gives feedback and makes decisions faster | Feedback SLA, decision log, bottleneck map |
| Risk Reduction | Lower bad-hire risk through qualification and assessment facts | Scorecards, structured qualification, references with factual notes |
| Manager Leverage | Hiring manager spends less time on unsuitable candidates | CV-to-interview conversion, manager hours saved |
Business Case for the Agency Fee
| Field | What to Include |
|---|---|
| Role Impact | What business capacity the vacancy blocks |
| Cost of Unfilled Vacancy | Cautious range of losses per week / month with confidence level |
| Internal Bottleneck | Why the internal recruitment process cannot deliver the needed speed or quality |
| Agency Intervention | What the agency specifically does: market mapping, qualification, shortlist, candidate management |
| Expected Effect | Shortened time-to-shortlist, more qualified interviews, less manager waste |
| Proof | Weekly reporting, shortlist-to-offer acceptance rate, feedback SLA, rejection reasons, offer progress |
| Risk Sharing | Re-filling terms, staged fee, exclusivity rules, client SLA commitments |
When an Agency Is Not Needed
| Situation | Why |
|---|---|
| Low-priority role with no clear cost of an unfilled vacancy | The fee is hard to justify |
| Criteria are not agreed | The agency will accelerate chaos |
| Client does not provide feedback | Shortlist quality cannot be calibrated |
| Compensation is well below market and non-negotiable | The agency will produce rejections, not hires |
| Internal funnel is already strong | Better to invest in process discipline |
7. Internal Recruitment Economics: How HRDs and
Recruitment Leaders Protect Resources
Internal recruitment often suffers from invisibility. While the process works, the business assumes that "candidates
just appear." When the process breaks, the recruiter is blamed. The economics of hiring help show
that results depend on a system: recruiter capacity, hiring manager discipline, compensation,
assessment, offer speed, candidate experience, onboarding.
What Resources Can Be Protected Through Economics
| Request | Economic Logic | Metrics to Show |
|---|---|---|
| Another Recruiter | Current workload exceeds capacity; SLA breaches are growing; priority vacancies are delayed | Active vacancies, candidates in process, SLA breaches, time-to-hire, action quality |
| ATS / Automation | Coordination is expensive and data gaps prevent process management | Stale candidates, missing notes, time per stage, reporting cost |
| Agency Budget | Cost of unfilled vacancy exceeds the fee or market access is needed | Role priority, vacancy duration, shortage of qualified candidates |
| Pay Range Review | Current range reduces conversion and offer acceptance | Rejection reasons, compensation mismatch, offer acceptance, pass-through |
| Referral Budget | Referrals can accelerate trust and conversion but require quality controls | Referral conversion, quality, retention, fairness review |
| Interviewer Training | Assessment errors increase the risk of a bad hire | Rating spread, missing assessment facts, low decision confidence |
| Onboarding Investment | Ramp-up directly affects role economics | Time-to-productivity, early turnover, manager feedback |
How to Talk to the CFO
A CFO is usually not against hiring. The CFO is against vague promises. A strong business case must show assumptions, range, risk, owner, and metric. Do not sell precision where you have a hypothesis.
| CFO Question | Good Answer |
|---|---|
| "Where does that figure come from?" | It is an estimate. We used the quota / backlog / manager hours, showed the range and confidence level. |
| "Why can't it be cheaper?" | Direct costs can be lower, but then vacancy duration and bad-hire risk increase. Here is the trade-off. |
| "How will we know it worked?" | In 4 weeks we review time-to-shortlist, qualified interviews, SLA breaches, and offer progress. |
| "Why not just wait?" | Each week of waiting creates an estimated cost or capacity loss. For some roles waiting is cheaper; for others, acting is. |
8. Business Case: Templates You Can Use
One-Page Business Case
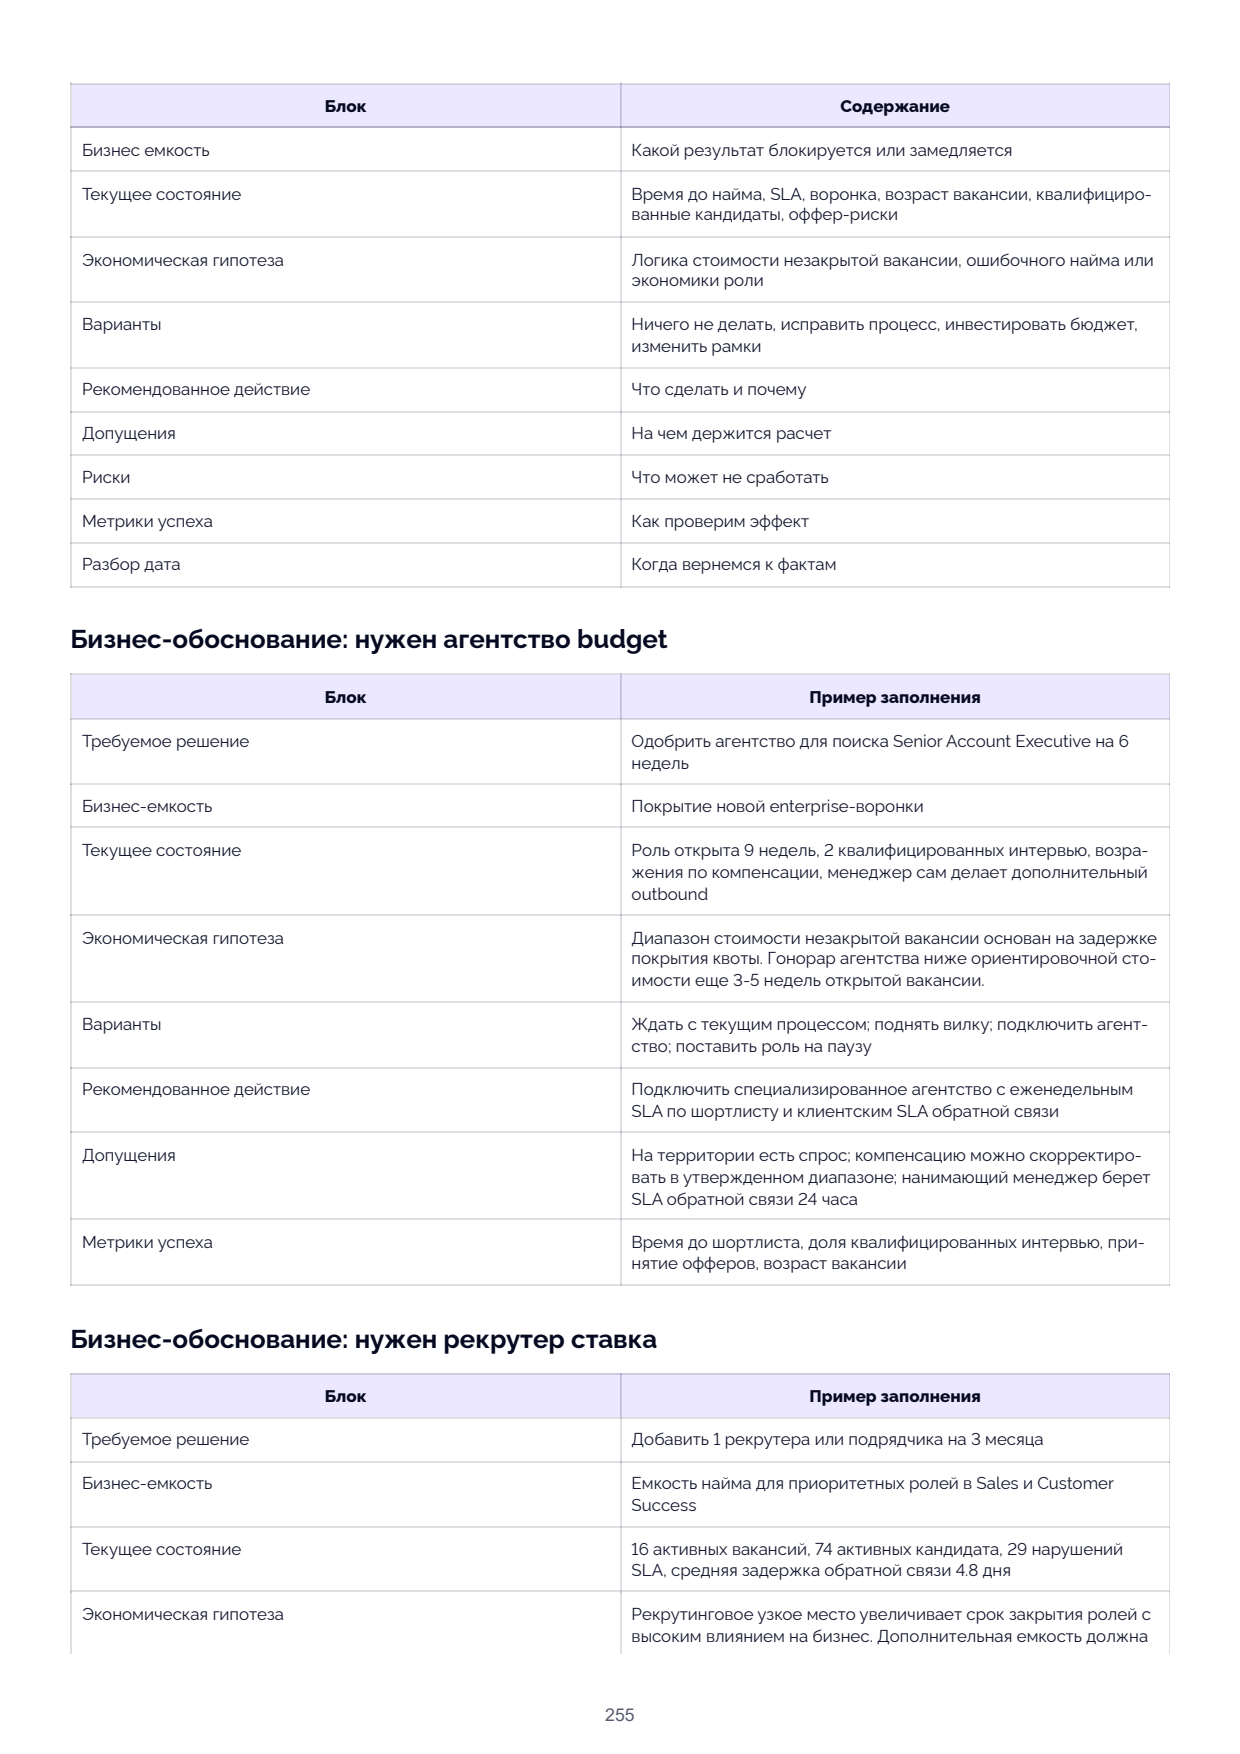
| Block | Content |
|---|---|
| Decision Required | What decision is needed: budget, agency, recruiter, pay range, referral bonus, assessment, manager SLA |
| Role / Affected Process | Which role or process is affected |
| Business Capacity | What outcome is being blocked or slowed |
| Current State | Time-to-hire, SLA, funnel, vacancy age, qualified candidates, offer risks |
| Economic Hypothesis | Logic of the cost of an unfilled vacancy, bad hire, or role economics |
| Options | Do nothing, fix the process, invest budget, change scope |
| Recommended Action | What to do and why |
| Assumptions | What the calculation depends on |
| Risks | What might not work |
| Success Metrics | How we will verify the impact |
| Review Date | When we return to the facts |
Example: Agency Budget Needed
| Block | Example Content |
|---|---|
| Decision Required | Approve an agency for a 6-week search for a Senior Account Executive |
| Business Capacity | Coverage of the new enterprise funnel |
| Current State | Role open for 9 weeks, 2 qualified interviews, compensation objections, manager making additional outbound themselves |
| Economic Hypothesis | Agency fee is lower than the estimated cost of another 3–5 weeks of an open vacancy |
| Options | Wait with the current process; raise the range; engage an agency; pause the role |
| Recommended Action | Engage a specialist agency with weekly shortlist SLA and client feedback SLA |
| Assumptions | Territory demand exists; compensation can be adjusted; manager maintains 24-hour feedback SLA |
| Success Metrics | Time-to-shortlist, qualified interview rate, offer acceptance, vacancy age |
Example: Additional Recruiter Needed
| Block | Example Content |
|---|---|
| Decision Required | Add 1 recruiter or contractor for 3 months |
| Business Capacity | Hiring capacity for priority roles in Sales and Customer Success |
| Current State | 16 active vacancies, 74 active candidates, 29 SLA breaches, average feedback delay 4.8 days |
| Economic Hypothesis | The recruitment bottleneck is extending the time-to-fill for high-impact roles |
| Options | Maintain current workload; lower vacancy priorities; engage an agency; add a temporary recruiter |
| Recommended Action | Temporary recruiter + weekly vacancy prioritisation |
| Assumptions | Managers maintain feedback SLA; role criteria are already clear; contractor reaches productivity within a week |
| Success Metrics | SLA breach rate, time-to-first-interview, stalled candidates, accepted offers for priority roles |
Example: Pay Range Review Needed
| Block | Example Content |
|---|---|
| Decision Required | Review compensation range for Senior Backend Engineer |
| Business Capacity | Roadmap delivery and reliability work |
| Current State | 5 finalists declined due to compensation; technical interviews go well; offer acceptance is low |
| Economic Hypothesis | Current range creates repeated late-stage losses after high internal time investment |
| Options | Maintain the range; lower the role level; change requirements; agree an exception |
| Recommended Action | Adjust the range or reformat the role to a lower level with a productivity ramp-up plan |
| Assumptions | Rejection reasons are documented; role requirements genuinely need senior-level |
| Success Metrics | Offer acceptance, finalist rejection reasons, vacancy close time, technical interview pass-through |
| Field | BDM in B2B SaaS Payments | Backend Engineer |
|---|---|---|
| What Decision It Supports | Clarify range / OTE, engage an agency, rebuild sourcing, or reduce scope | Review range / level, add interview capacity, reduce scope, or engage an agency |
9. Hiring Economics Metrics
An economic metric must answer a management question. Without a question, the metric quickly becomes dashboard decoration or a punishment tool.
| Metric | Formula / How to Calculate | What It Shows | How to Use It | How NOT to Use It |
|---|---|---|---|---|
| Cost of Hiring | External costs + internal time cost + tools + assessment + onboarding | Total cost of filling a role | Compare role families, channels, process changes | Make it a target to minimise at any cost |
| Cost of Unfilled Vacancy | Estimated business impact × vacancy duration | Price of an open role | Prioritise roles and bottlenecks | Pretend the estimate is accurate to the penny |
| Time to Hire | Days from candidate entering the process to accepted offer | Speed of the candidate process | Identify delay stages | Compare roles without accounting for complexity |
| Vacancy Close Time | Days from vacancy opening to accepted offer | Speed of filling a role | Plan capacity | Blame only the recruiter for manager delays |
| Time per Stage | Stage exit date − stage entry date | Where the process gets stuck | Tune SLAs and owners | Update status just for a nice metric |
| SLA Breach Rate | Overdue stages ÷ all active stages | Response discipline | Manage feedback and decision delays | Punish without root-cause analysis |
| Offer Acceptance Rate | Accepted offers ÷ sent offers | Quality of pre-negotiation alignment | Improve the offer process | Draw conclusions from a small sample |
| Qualified Interview Rate | Qualified interviews ÷ candidates presented | Quality of intake and criteria | Compare sources and agencies | Demand 100% and kill market exploration |
| Bad Hire Proxy | Early turnover, probation failure, low performance, manager escalations | Hiring error risk | Improve assessment and onboarding | Label people without analysing the system |
| Hiring Quality Estimate | Performance, retention, time to productivity, manager satisfaction | Long-term hiring value | Calibrate criteria | Reduce to a single universal number |
| Role Economics Hypothesis | Contribution over tenure − total costs − risk adjustment | Long-term role economics | Justify quality, onboarding, retention | Dehumanise candidates |
Minimum Dashboard for the HRD
| Dashboard Block | Metrics | What Decision It Supports |
|---|---|---|
| Vacancy Priority | Vacancy age, business impact, confidence in unfilled-vacancy cost estimate | Where to direct the recruiter's, agency's, or manager's attention |
| Process Speed | Time-to-hire, time per stage, SLA breaches | Where to accelerate the process |
| Quality Signals | Qualified interview rate, rejection reasons, scorecard confidence | Where to improve criteria and assessment |
| Offer Economics | Offer acceptance, compensation-related rejections, counter-offer risk | Where to change pre-negotiation alignment, range, and offer strategy |
| Resource Load | Active vacancies per recruiter, active candidates, action quality | Whether a headcount / contractor is needed |
| Risk and Compliance | Missing notes, unconfirmed decisions, consent gaps | Where an audit is needed |
10. The HarmonyATS Example
HarmonyATS should not be a "magical hiring economics calculator." Economics require business assumptions: quota, backlog, margin, delivery risk, manager time, and role priority. But the ATS provides the factual foundation without which the conversation turns into gut feeling.
| HarmonyATS Report / Area | How to Use in Hiring Economics | Important Caveat |
|---|---|---|
| Time-to-Hire Report | See speed from candidate entry to accepted offer; compare stages and roles | Time to hire does not equal hiring quality |
| SLA Report | Find candidates and stages where delay creates vacancy cost or drop-off risk | SLA breaches need to be reviewed by owner and root cause |
| Vacancy Report | View active vacancies and candidate distribution across stages | Many candidates do not mean a healthy funnel |
| Funnel with Details | See conversions and losses by stage | Low conversion may be normal if the stage filters correctly |
| Rejection Report | Understand why candidates or the company decline | Reasons must be clean and unambiguous |
| Recruiter Report | See workload, actions, meetings, comments, stage changes | Action volume does not replace quality and business impact |
| Candidate Source Report | Compare sources by quality, not just volume | Source ROI requires looking at downstream funnel conversion and retention |
| Data Consent Report | Monitor legal and privacy hygiene | Economics do not justify consent violations |
How to Build an Economic Note from ATS and Business Data
| Step | What to Take from ATS | What to Add from the Business |
|---|---|---|
| 1. Define Vacancy Priority | Vacancy age, current-stage distribution | Business owner, role impact, priority |
| 2. Identify the Bottleneck | SLA breaches, time per stage, funnel losses | Manager availability, compensation, market constraints |
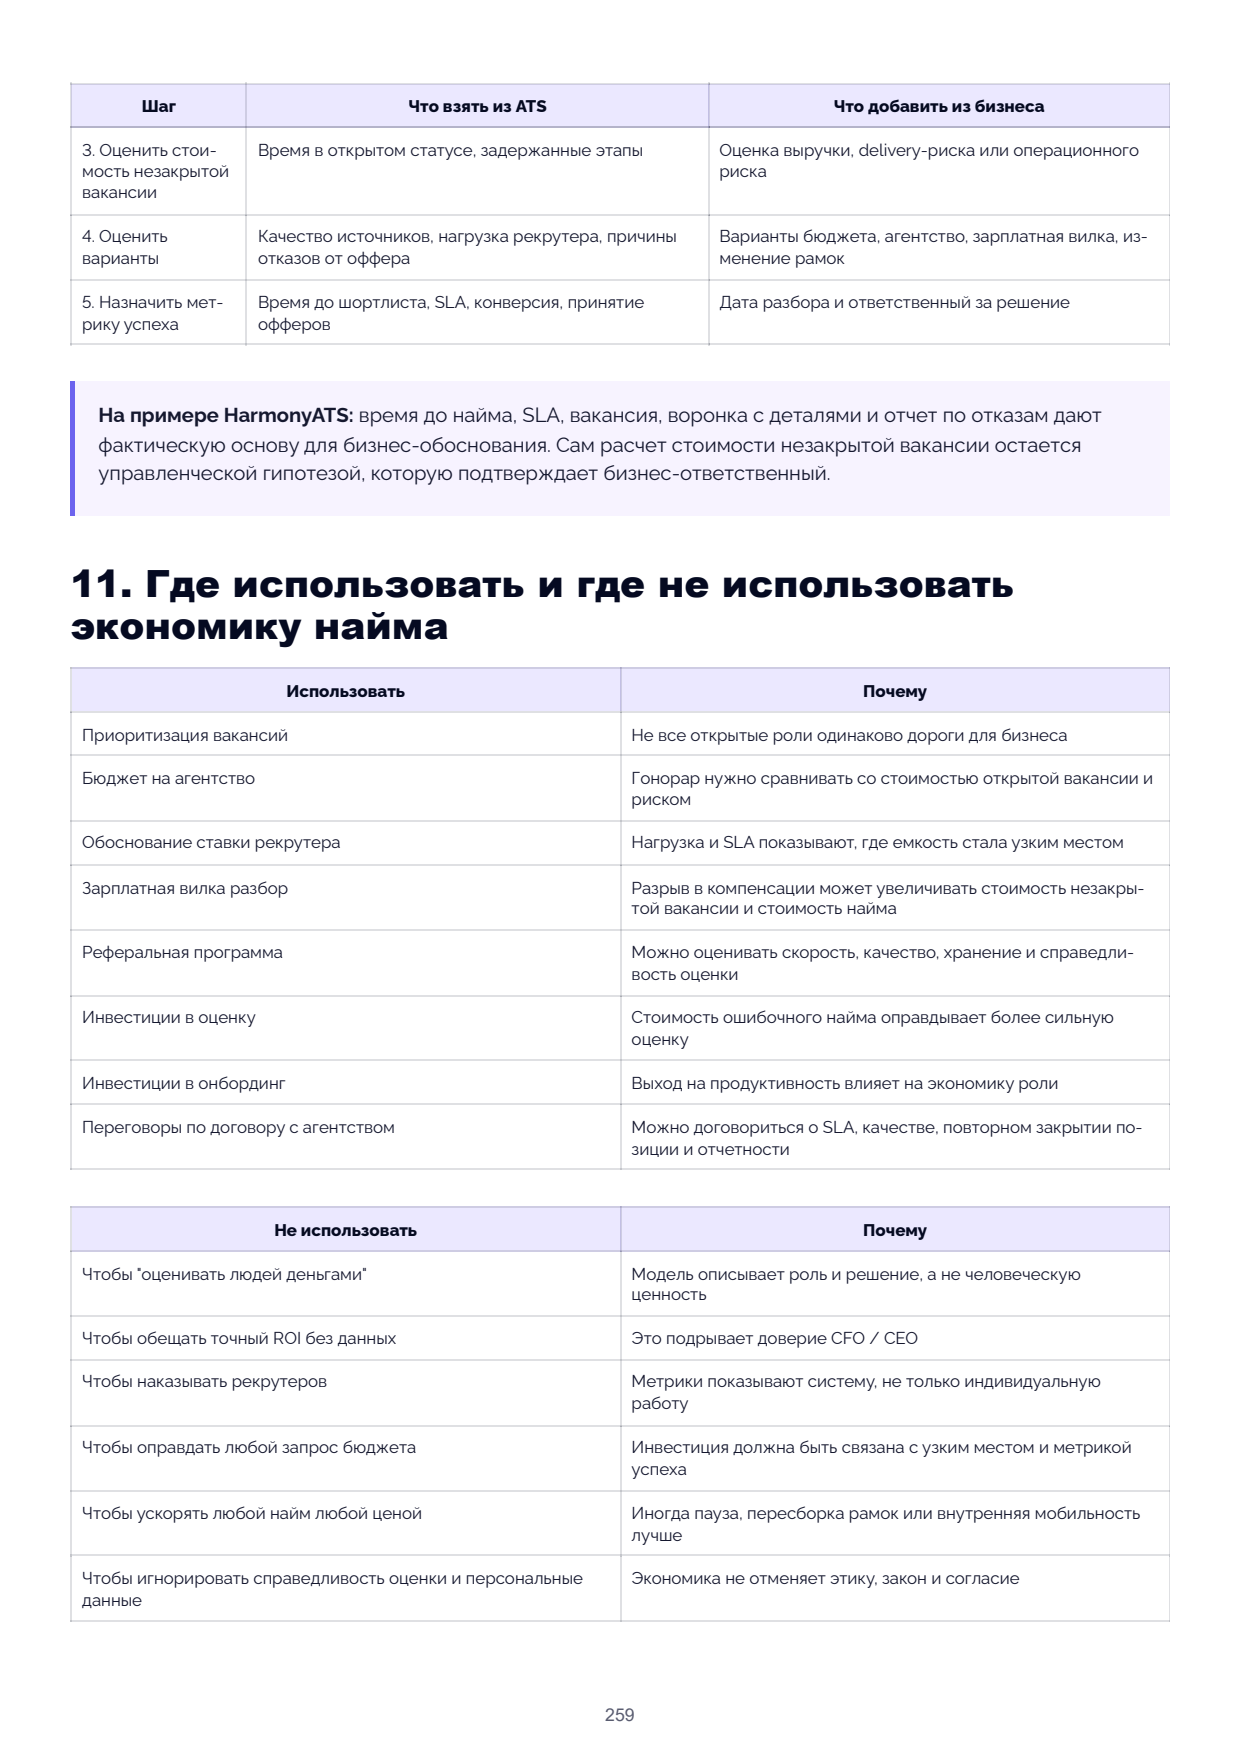
| 3. Estimate Cost of Unfilled Vacancy | Time in open status, delayed stages | Revenue estimate, delivery risk, or operational risk |
| 4. Assess Options | Source quality, recruiter workload, offer-rejection reasons | Budget options, agency, pay range, scope changes |
| 5. Assign Success Metric | Time-to-shortlist, SLA, conversion, offer acceptance | Review date and decision owner |
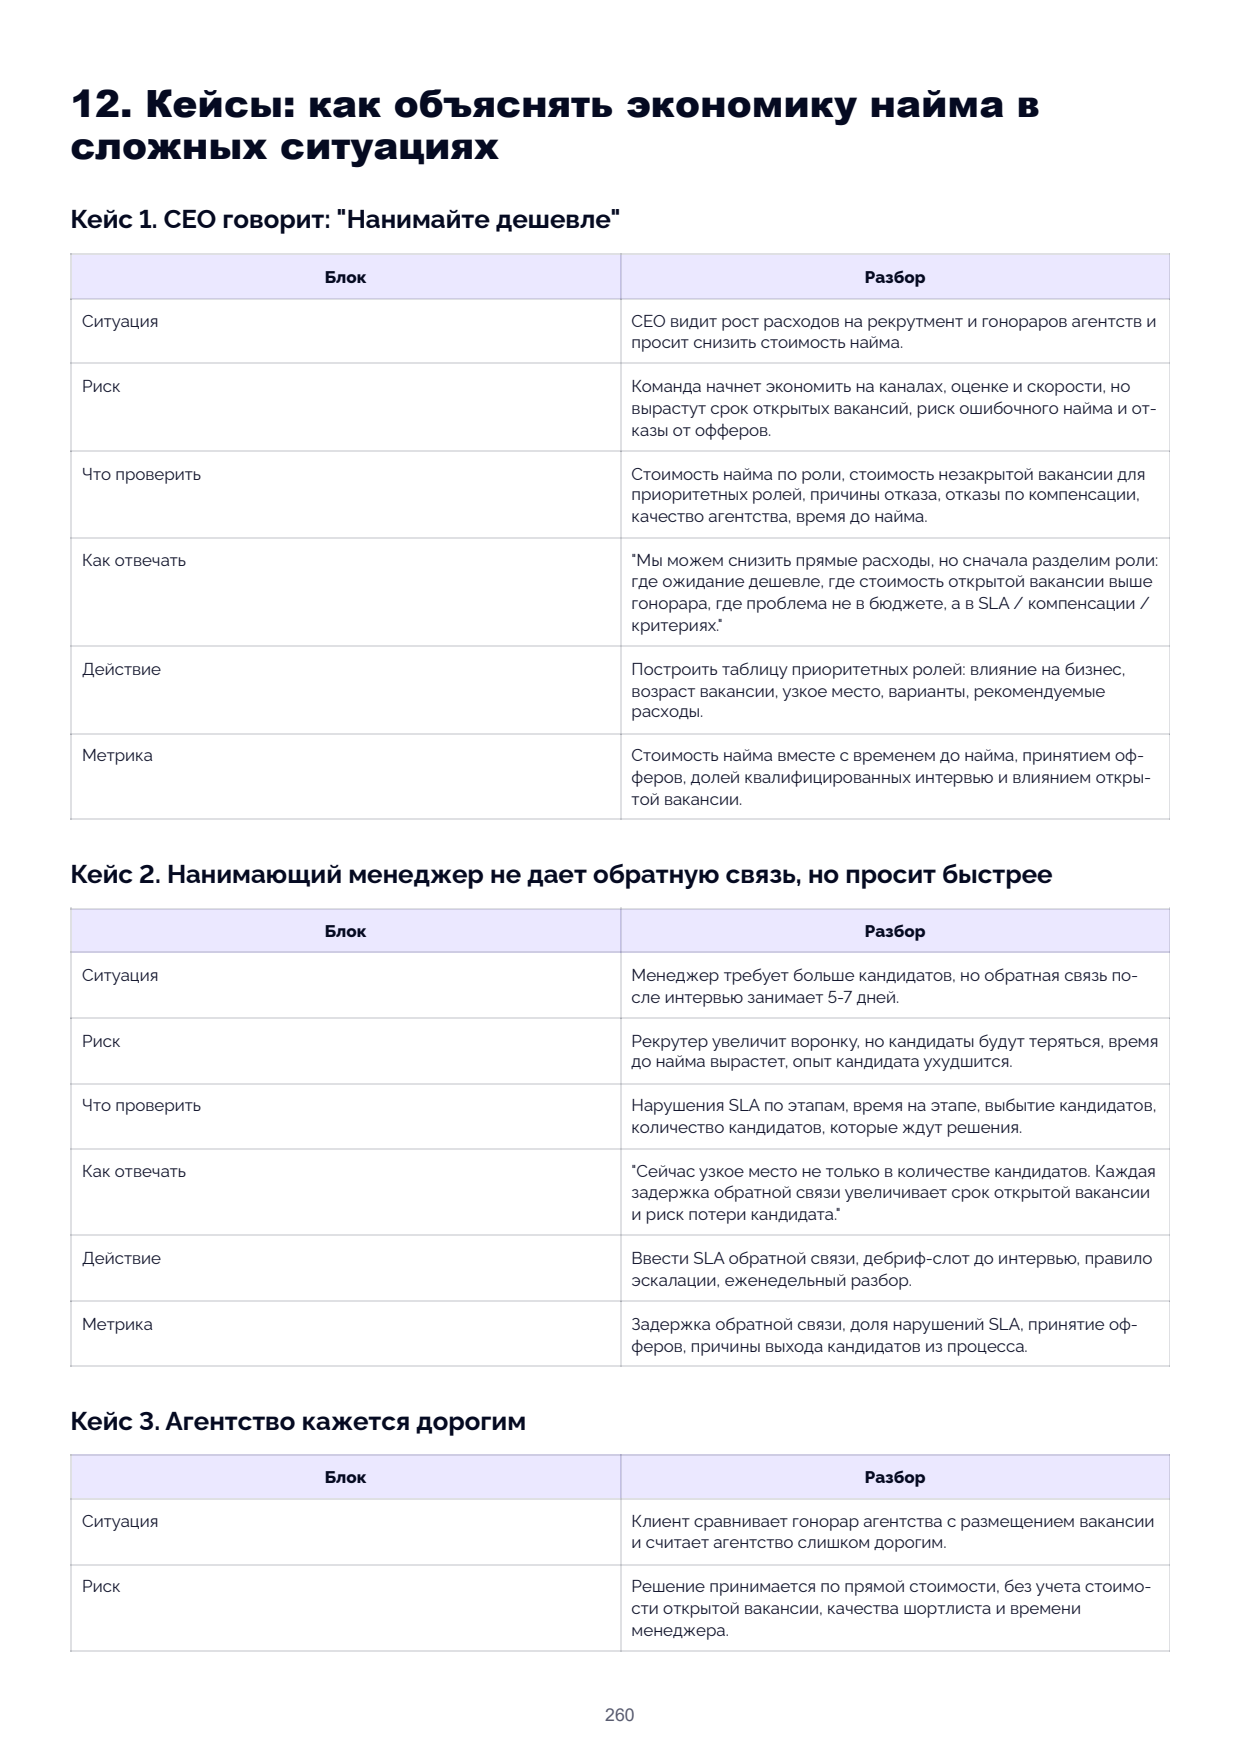
12. Case Studies: Explaining Hiring Economics in Difficult Situations
| Case | What to Check | How to Respond | Action | Metric |
|---|---|---|---|---|
| CEO says: "Hire more cheaply" | Hiring cost by role, cost of unfilled vacancy, rejection reasons, agency quality, time-to-hire | We can reduce direct costs, but first let us split the roles: where waiting is cheaper and where the cost of an open vacancy exceeds the savings | Build a priority-role table: business impact, vacancy age, bottleneck, options, recommended spend | Hiring cost together with time-to-hire, offer acceptance, and qualified interview rate |
| Manager does not give feedback but asks for more speed | SLA breaches by stage, time per stage, candidate drop-off, number of candidates awaiting decision | The bottleneck is not just candidate quantity. Every feedback delay extends vacancy duration and increases drop-off risk | Introduce feedback SLA, a pre-interview debrief slot, escalation rule, weekly review | Feedback delay, SLA breach rate, offer acceptance, candidate drop-off reasons |
| Agency seems expensive | Vacancy age, internal funnel, qualified candidates, manager time cost, unfilled-vacancy cost range | The fee should be compared not to a job posting but to the cost of additional weeks of an open role and management overhead | Offer a time-limited engagement with weekly shortlist quality and SLA reporting | Time-to-shortlist, shortlist-to-offer acceptance, interview pass-through, offer progress |
| Need to raise the pay range | Rejection reasons, offer acceptance, compensation expectations, candidate drop-off stage, role level realism | The range need not be raised, but then the role level must be lowered or a longer vacancy accepted | Compare options: raise range, lower level with ramp-up plan, pause the role, or redesign it | Offer acceptance, late-stage rejections, vacancy close time, finalist quality |
| Need referral bonus but risk of closed network | Referral conversion, retention, performance proxy, source structure, fairness review | A referral bonus is useful if we measure not just referral volume but quality, retention, and assessment fairness | Launch the programme with transparent criteria, consistent assessment, and source-structure review | Referral → interview, referral → hire, retention, quality proxy, source concentration |
13. SOP: How to Implement Hiring Economics
SOP: Economic Note for a Priority Vacancy
| Field | Description |
|---|---|
| Purpose | Give the business owner, HRD, and recruitment lead a common language for vacancy prioritisation |
| Scope | Used for high-priority roles, roles with long fill times, expensive agency solutions, range exceptions, and critical re-fills |
| Roles | Recruitment lead owns the note; manager owns business impact; finance reviews material monetary assumptions; HRD makes the final decision |
| Inputs | Vacancy age, stages, time-to-hire, SLA breaches, rejection reasons, offer data, recruiter workload, business impact estimate |
| Steps | 1) Define the role's business capacity. 2) Gather facts from the ATS. 3) Describe the bottleneck. 4) Estimate the unfilled-vacancy cost range and confidence. 5) Formulate options. 6) Choose a recommendation. 7) Assign success metrics and review date. |
| SLA / Timelines | For a critical role, the note is prepared within 2 working days of the role being flagged as priority or after 2 weeks of material delay |
| Required Fields | Role, owner, business capacity, current state, economic hypothesis, assumptions, confidence, options, recommendation, metric, review date |
| Outputs | One-page economic note and decision log |
| Exceptions | Not required for low-impact roles, re-fills without delay, and roles with clear SLAs that do not require a budget decision |